Dashboard and the widgets
The widgets on the Dashboard explained
Introduction
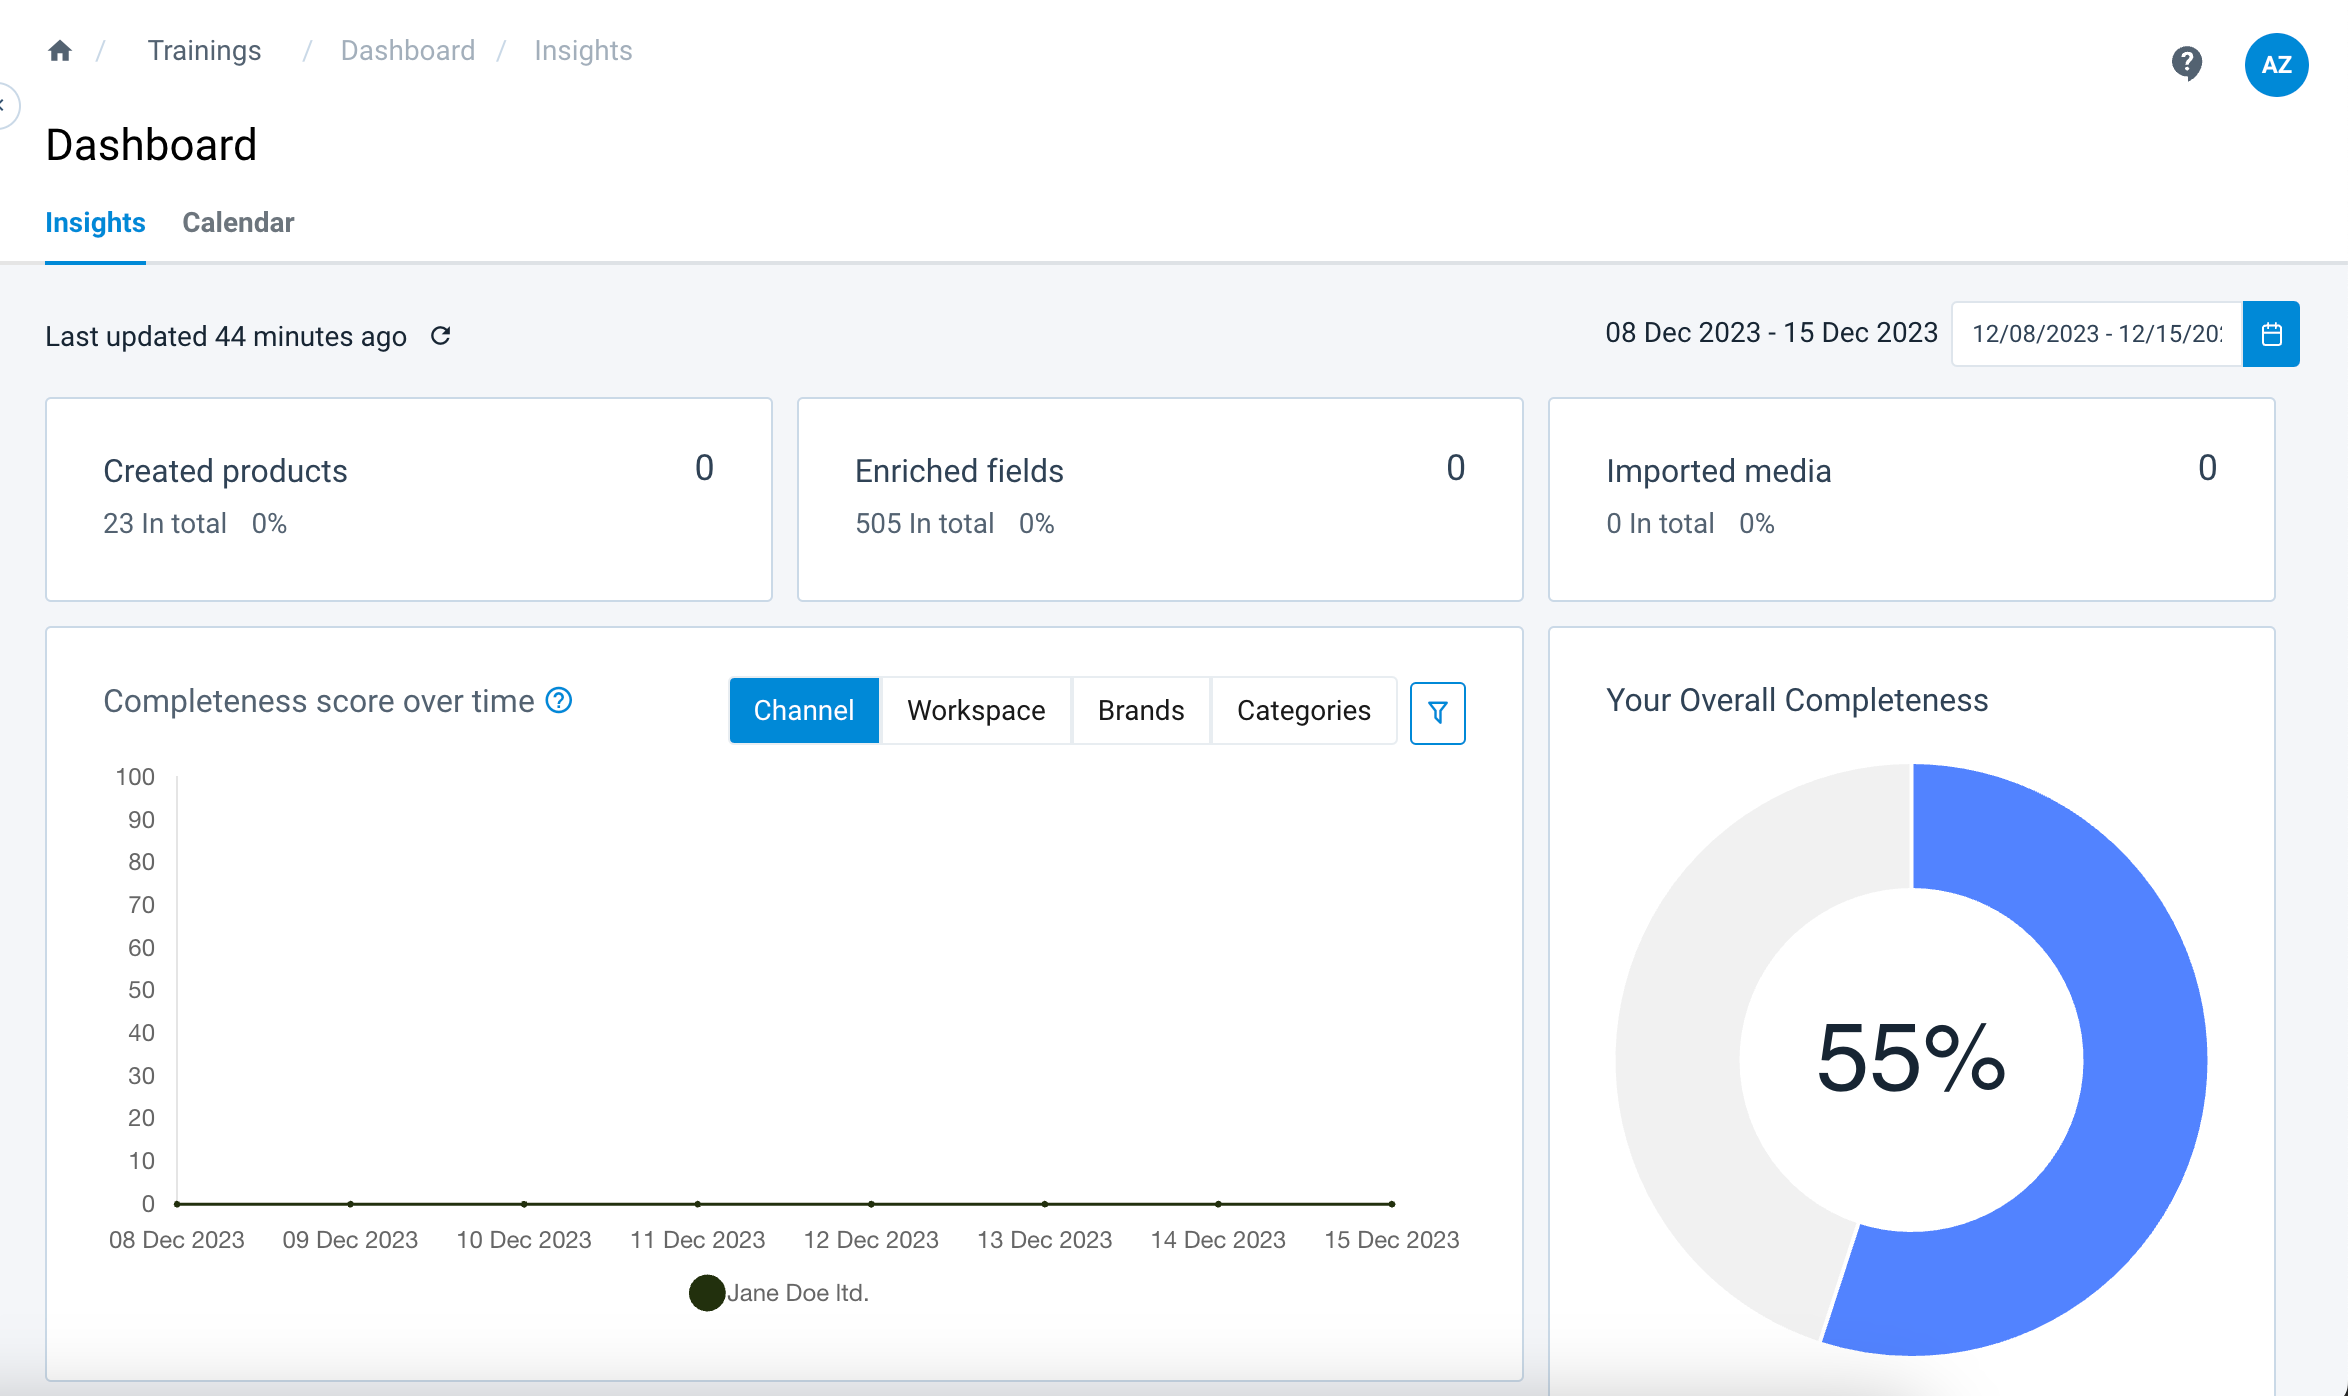
The 'Dashboard' is the bulk of the main screen. It shows many widgets with different functions that give a quick overview of and links to your registered products and data. Every widget has its article, where it is discussed in detail. Here, a quick overview will be given of all the widgets.
| Dashboard Element | Purpose |
|---|---|
| Created products | Keep track of the number of products you have uploaded to the system. |
| Enriched fields | Track the amount of product information that has been filled out in the proper fields. |
| Imported media | View how many pictures have been uploaded to the system. |
| Completeness score over time | See the overall completion of product registration over the period set in the date picker. |
| Your Overall Completeness | Access a clear, direct overview of the total completion of all registered products. |
| Tasks | View an overview of all tasks you have set. |
| Calendar | Monitor the number of products added, edited, or deleted on any day of the selected week. |
| Organisation labels | See the number of products at each stage of the registration process. |
| Channel Analytics | View a percentage-based representation of the overall completion of registered products per channel. |
| Master Data Analytics | View a percentage-based representation of the completeness of your master data and overall product information. |
| Recently Updated Products | View a list of the five most recently updated products. |
The widget Created products
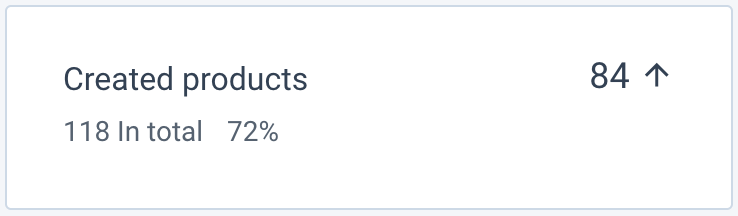
This widget tracks your product uploads. It displays the total number of products in the system alongside a trend indicator (arrow) and percentage, showing the volume of items added or removed during your selected date range.
The widget Enriched fields
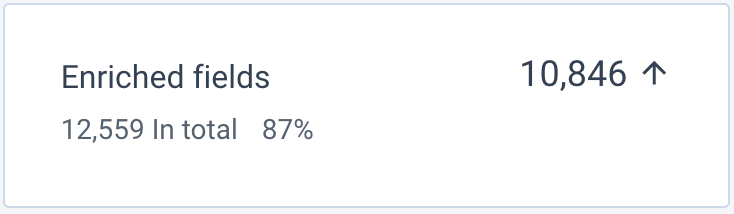
This widget monitors the completion of product information fields. It displays the total number of filled fields and tracks changes within your selected timeframe, using an arrow and percentage to show the net gain or loss of data entries.
The widget Imported media
The Imported media widget tracks how many image files have been uploaded to the system.
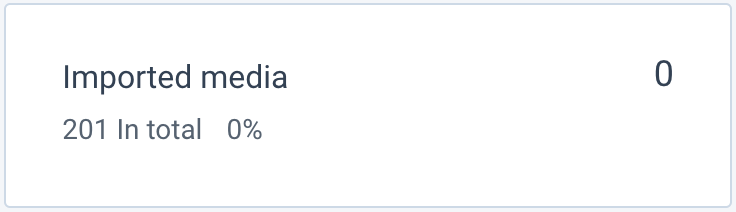
The line '<number> in total' shows how many pictures have been uploaded in total. The bold number with an arrow next to it shows how many pictures have been uploaded or removed in the time slot as selected in the date picker. An arrow pointing up means this amount of files has been uploaded, and an arrow pointing down means this amount of files has been removed.
The percentage next to the total amount shows what percentage of the total amount of pictures has been uploaded in the timeslot selected in the data picker.
The widget Completeness score over time
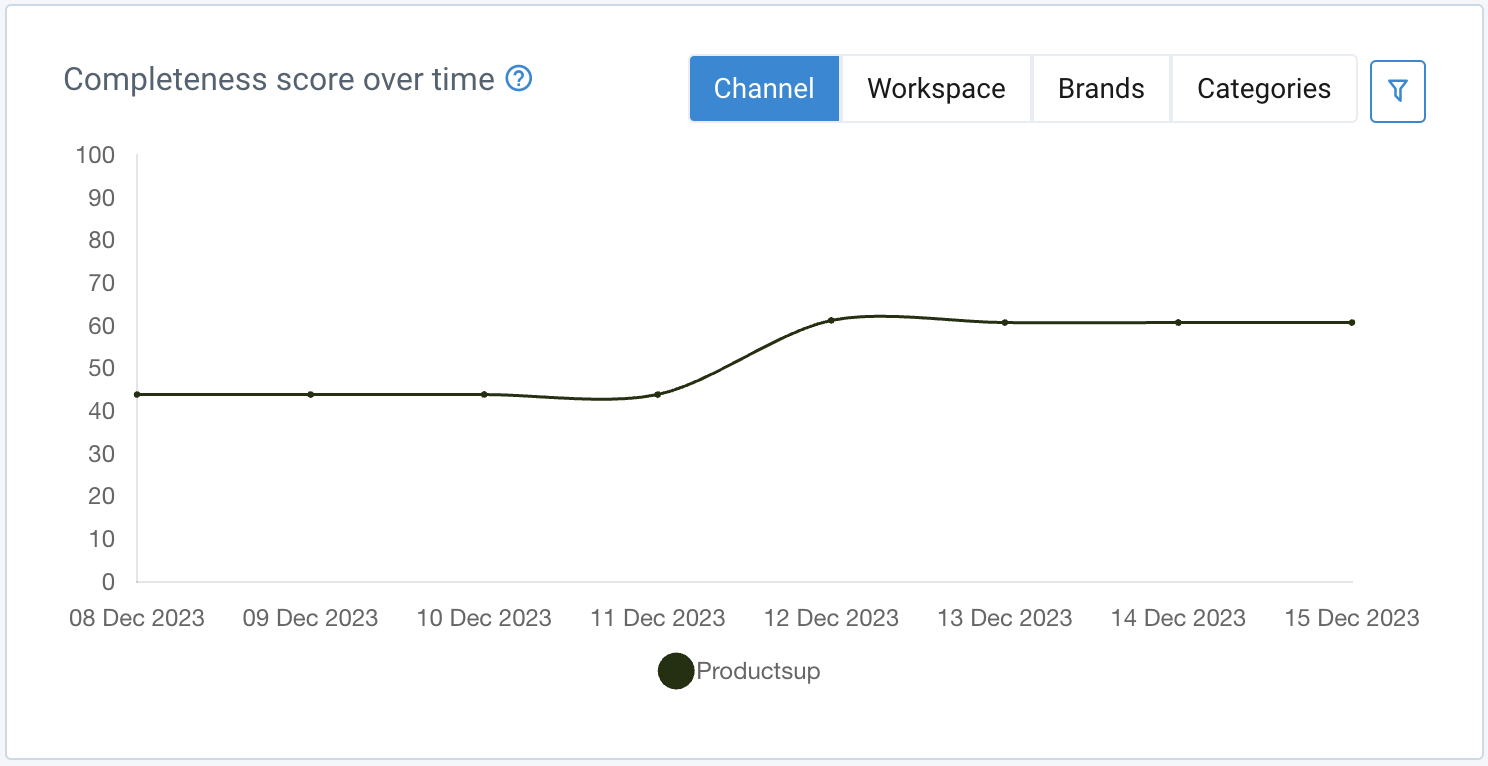
This widget tracks product registration completeness (%) across your selected date range. Use the color-coded legend to compare delivery channels; clicking a channel name toggles its visibility in the graph, allowing for easy performance comparisons between specific stations.
The widget Your Overall Completeness
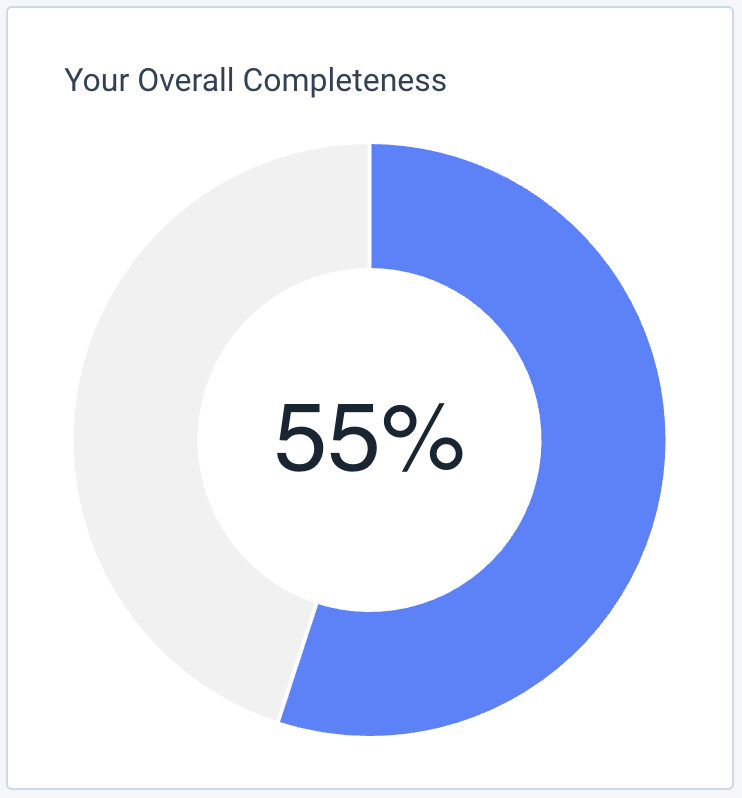
The widget ‘Your Overall Completeness’ shows a clear and directly visible overview of your total completion of all registered products. Your completion is expressed both as a percentage and in a circle graph.
The widget Tasks
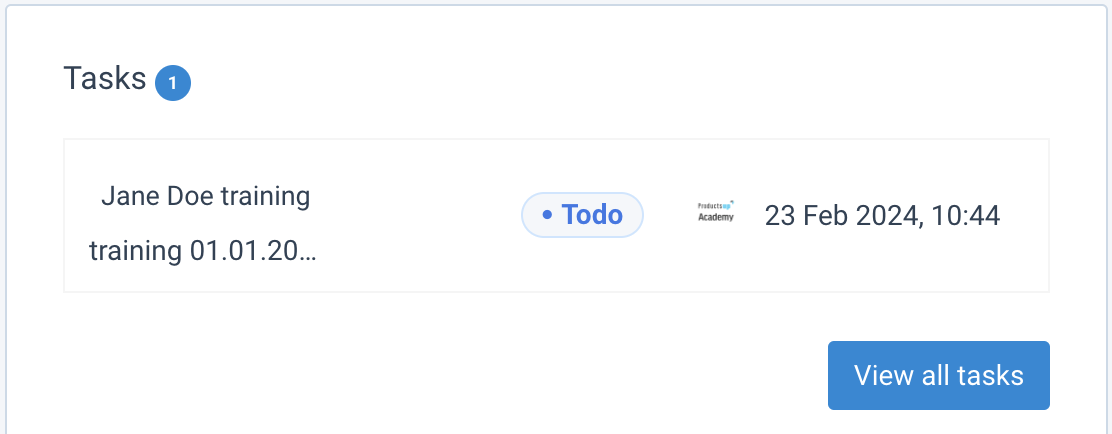
In the Tasks widget, you can find an overview of all tasks that you have set. If the amount of tasks exceeds the size of the widget, you can scroll through them. At the top of the widget, next to the title Tasks, the number in the blue circle indicates how many tasks there are left. Next to the name of the tasks, a color-coded status icon indicates the status of the task. Next, the logo of your organization and the date when the task was added are seen. Clicking a task directs you to a page with more detailed information regarding this task. Clicking the button ‘View all tasks’ directs you to a page with all tasks and more detailed information.
The widget Calendar
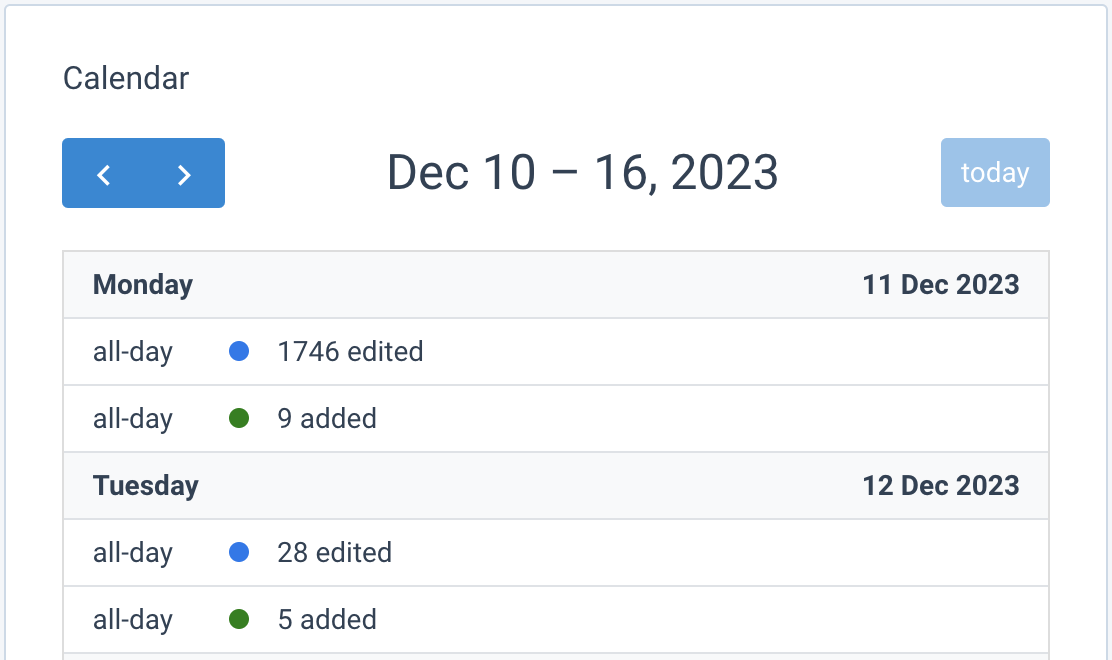
The widget ‘Calendar’ shows the amount of products that have been added, edited, or deleted on any given day of the selected week, as well as tasks that have been set on this day. The blue arrow buttons allow for the selection of a specific week, either in the past, present, or future. Clicking the ‘today’-button automatically selects the current week. For every day of the week, a timeslot is given, and color-coded status changes of products are shown, along with the amount of added, edited, or deleted products. Clicking on an item on the calendar directs you to the appropriate page. Opening a task shows the task page with all the necessary info. Opening a status change directs you to the appropriate product list.
The widget Organisation labels
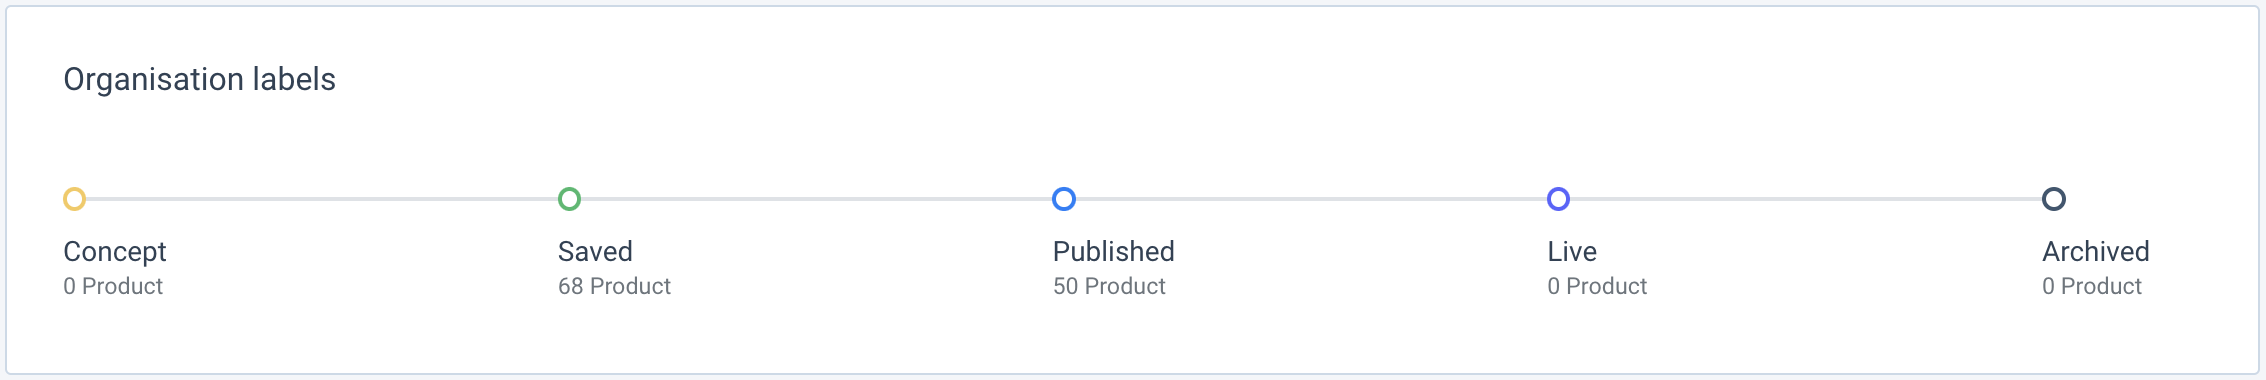
The widget ‘Organisation labels’ shows you the amount of products at any stage of the registration. The statuses of your products represent your workflow and give you a quick view of the amount of registration work left to do. Ideally, all your products would be found with either the status 'Published', or the status 'Live'.
| Organisation label | Purpose |
|---|---|
| Concept | Counts all products that have just been imported or added. |
| Saved | Counts all products that have recently been changed or adapted, where the change has been saved. Most active product work falls under this label. |
| Published | Counts all products that have been approved and are ready to be shared with retailers and other clients. |
| Live | Used for products that your organization has manually published on a website to make public. |
| Archived | Shows the amount of products that have been archived and will be filtered out on the product page. |
The widget Channel Analytics
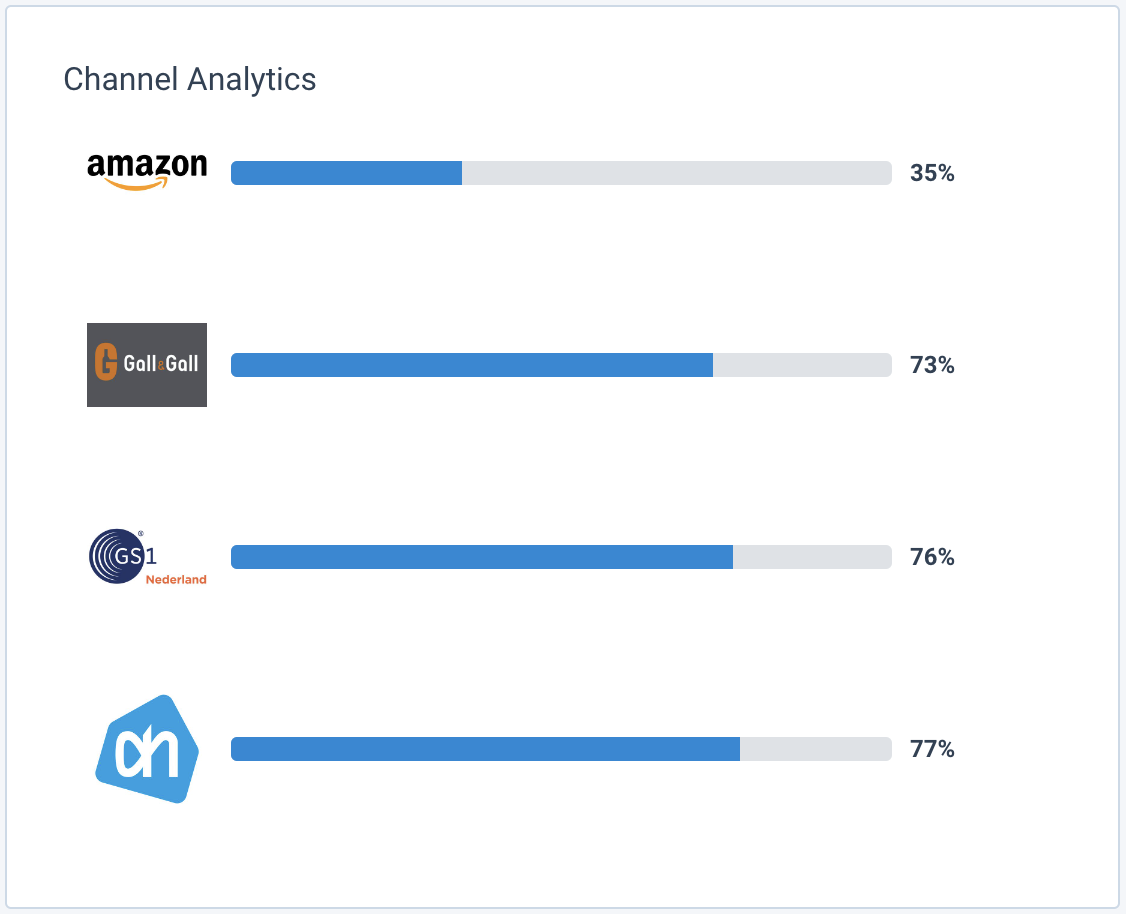
In the widget ‘Channel Analytics’, a percentual representation is shown of the overall completion of registered products per channel. This is the same as the channels over time, but at one specific moment. The channels are represented with a picture logo, and next to the logo a bar shows the percentages. A fully filled bar means a completed registration process. The percentage is also represented with a number, which changes color as progression is achieved.
The widget Master Data Analytics
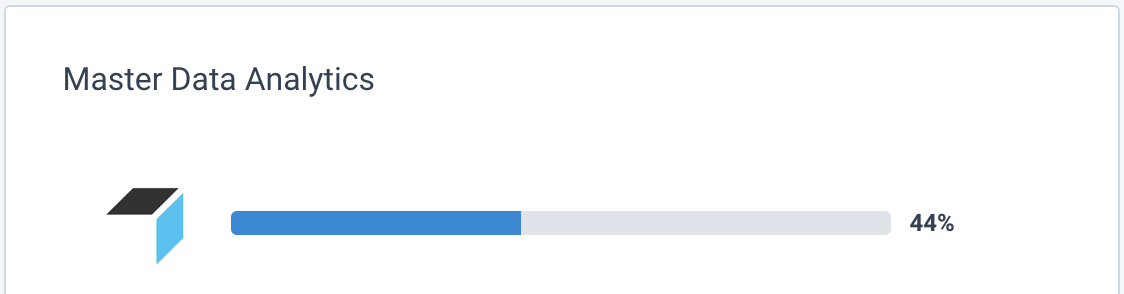
In the widget ‘Master Data Analytics’, a percentual representation is shown of the overall information registration of your products. The channels are represented with a picture logo, and next to the logo, a bar shows the percentages. A filled bar means a completed registration process. The percentage is also represented with a number, which changes color as progression is achieved.
The widget Recently Updated Products
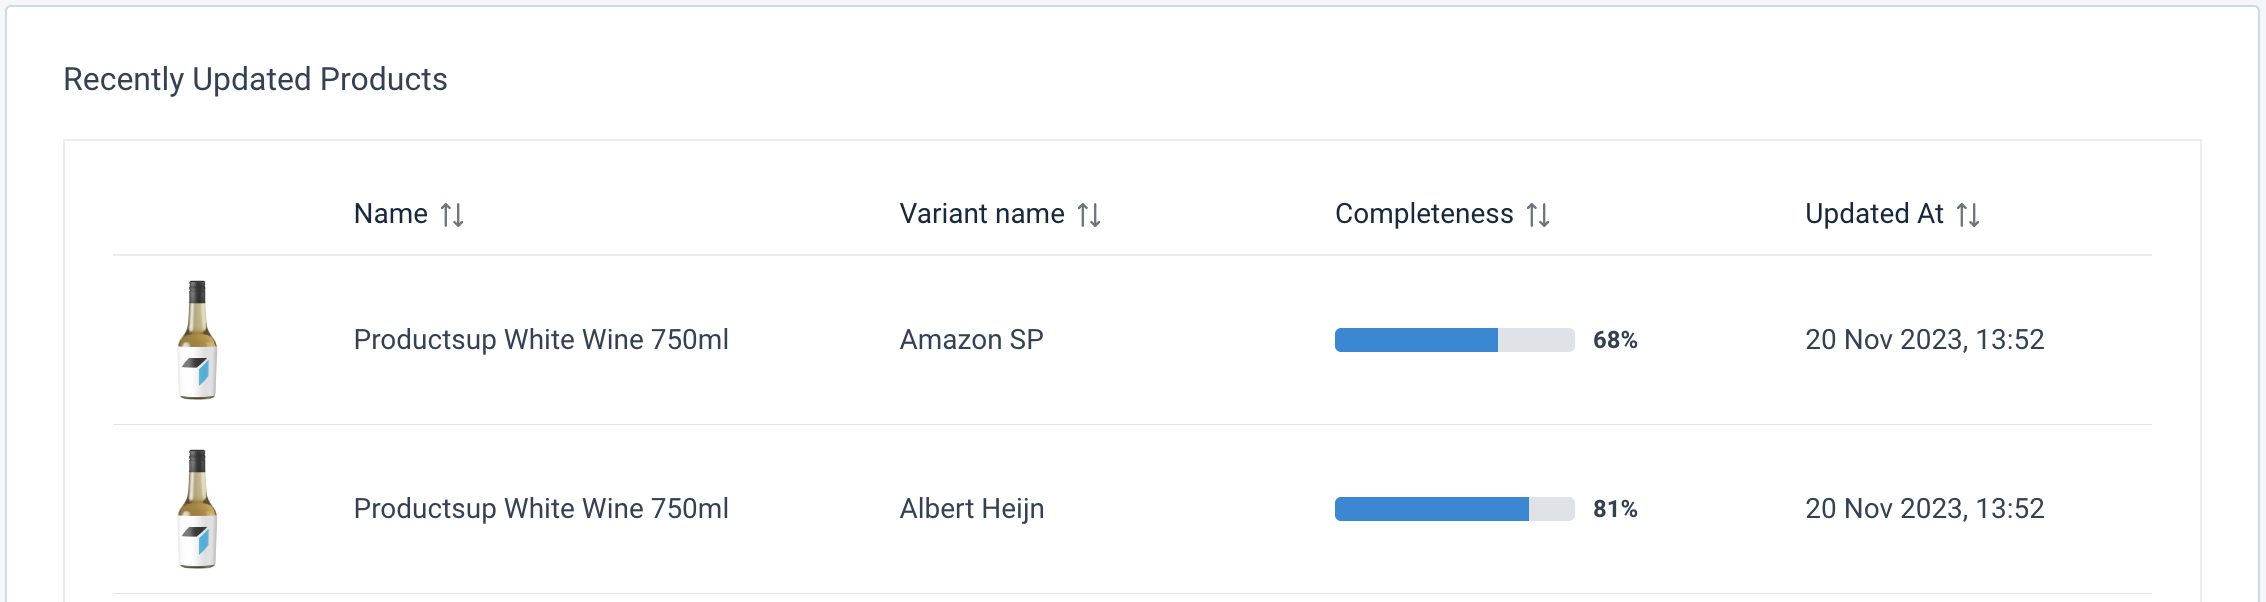
In the widget ‘Recently Updated Products’, a list of the five most recently updated products is shown. Each product is represented with an image of the product, the name of the product, the total completion of registering the product info, and the last date that the product was updated.
How is this guide?