

Analyze your data in Data View
Learn to analyze your attribute data in Data View in Productsup.
Introduction
When you set up all your exports and map the needed attributes from import to export, it is time to get your data ready for your channels. To help you identify what items and attributes require optimization, Productsup offers attribute data analytics features in Data View. These features can help you see how many attribute values are empty, what type of data the values should have, whether they meet the channel requirements, and so on.
This document focuses on Data View data quality insights only. See Optimize your data in Data View with rule boxes for guidance on using rule boxes to transform the data.
Functionality overview
The features that provide data quality analysis in Productsup Data View:
- Analyze is a feature in Data View that provides insights into product data completness and accuracy per attribute against an export channel requirements.
- Analyzer tests is how we call validation rules defined by the export channels. They dictate which attributes are required, and hence can not be empty; or describe more specific rules, such as "SKU can only contain digits".
- Radiness score is a Data View option at the Export stage that shows how many mandatory attributes are export-ready.
- Optimization score is a Data View option at the Export stage that shows how many mandatory and optional attributes are export-ready.
You can use Analyze at any stage in your site to track how your data changes throughout the stages. But most insights belong to the Export stage, where you can use Analyze, Readiness score and Optimization score. All channels have different requirements, so you need to analyze and optimize your attribute data for each export individually.
1. Analyze
The Analyze functionality is a part of the Data View menu that provides data analytics. You can access it in two ways:
Access the menu
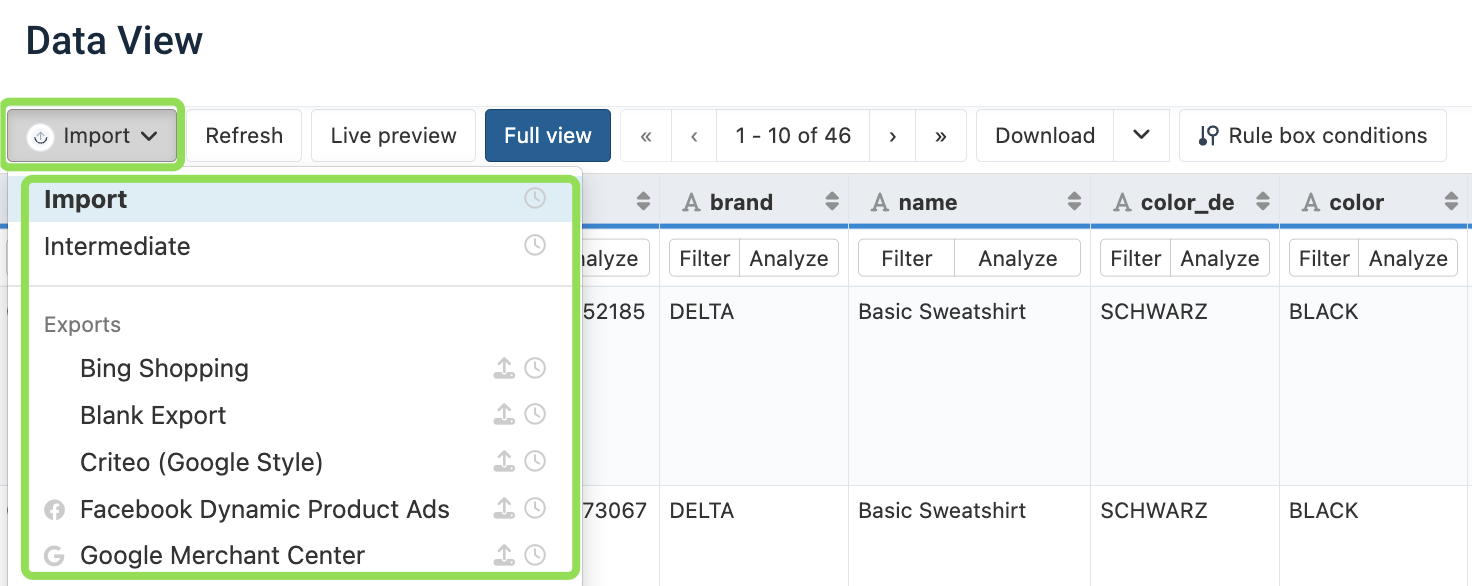
Go to Data View and select the needed stage or desired Export from the dropdown on the left.
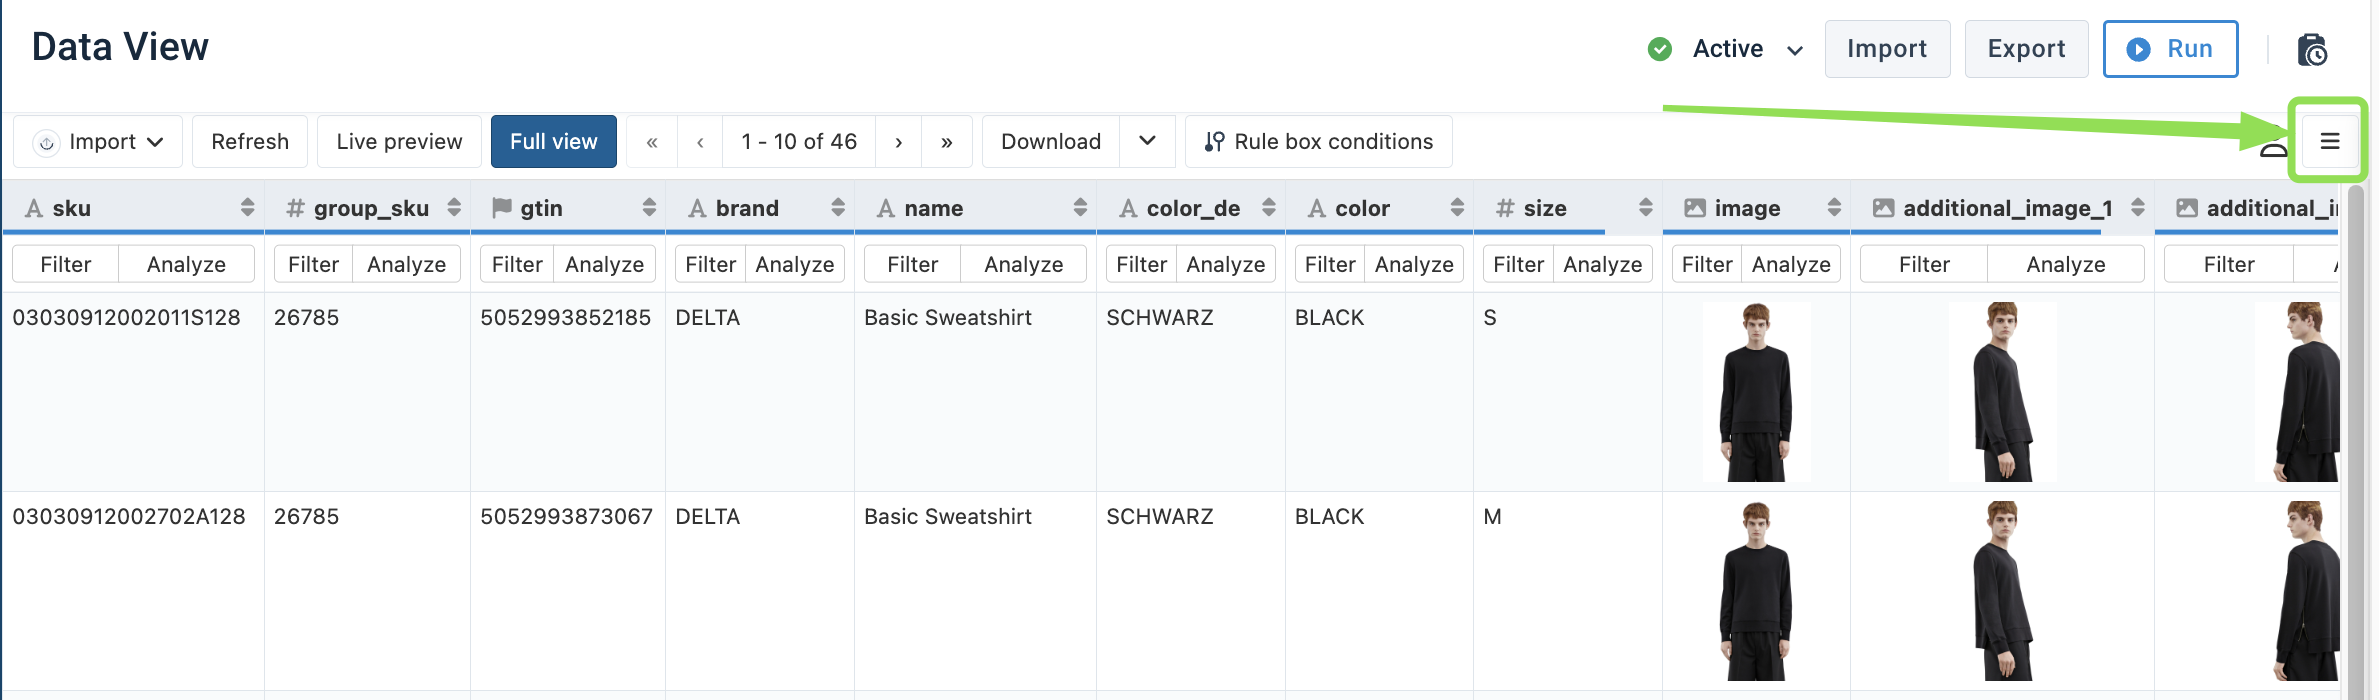
Open the context menu on the right and select the tab marked with a "pie-chart" icon.
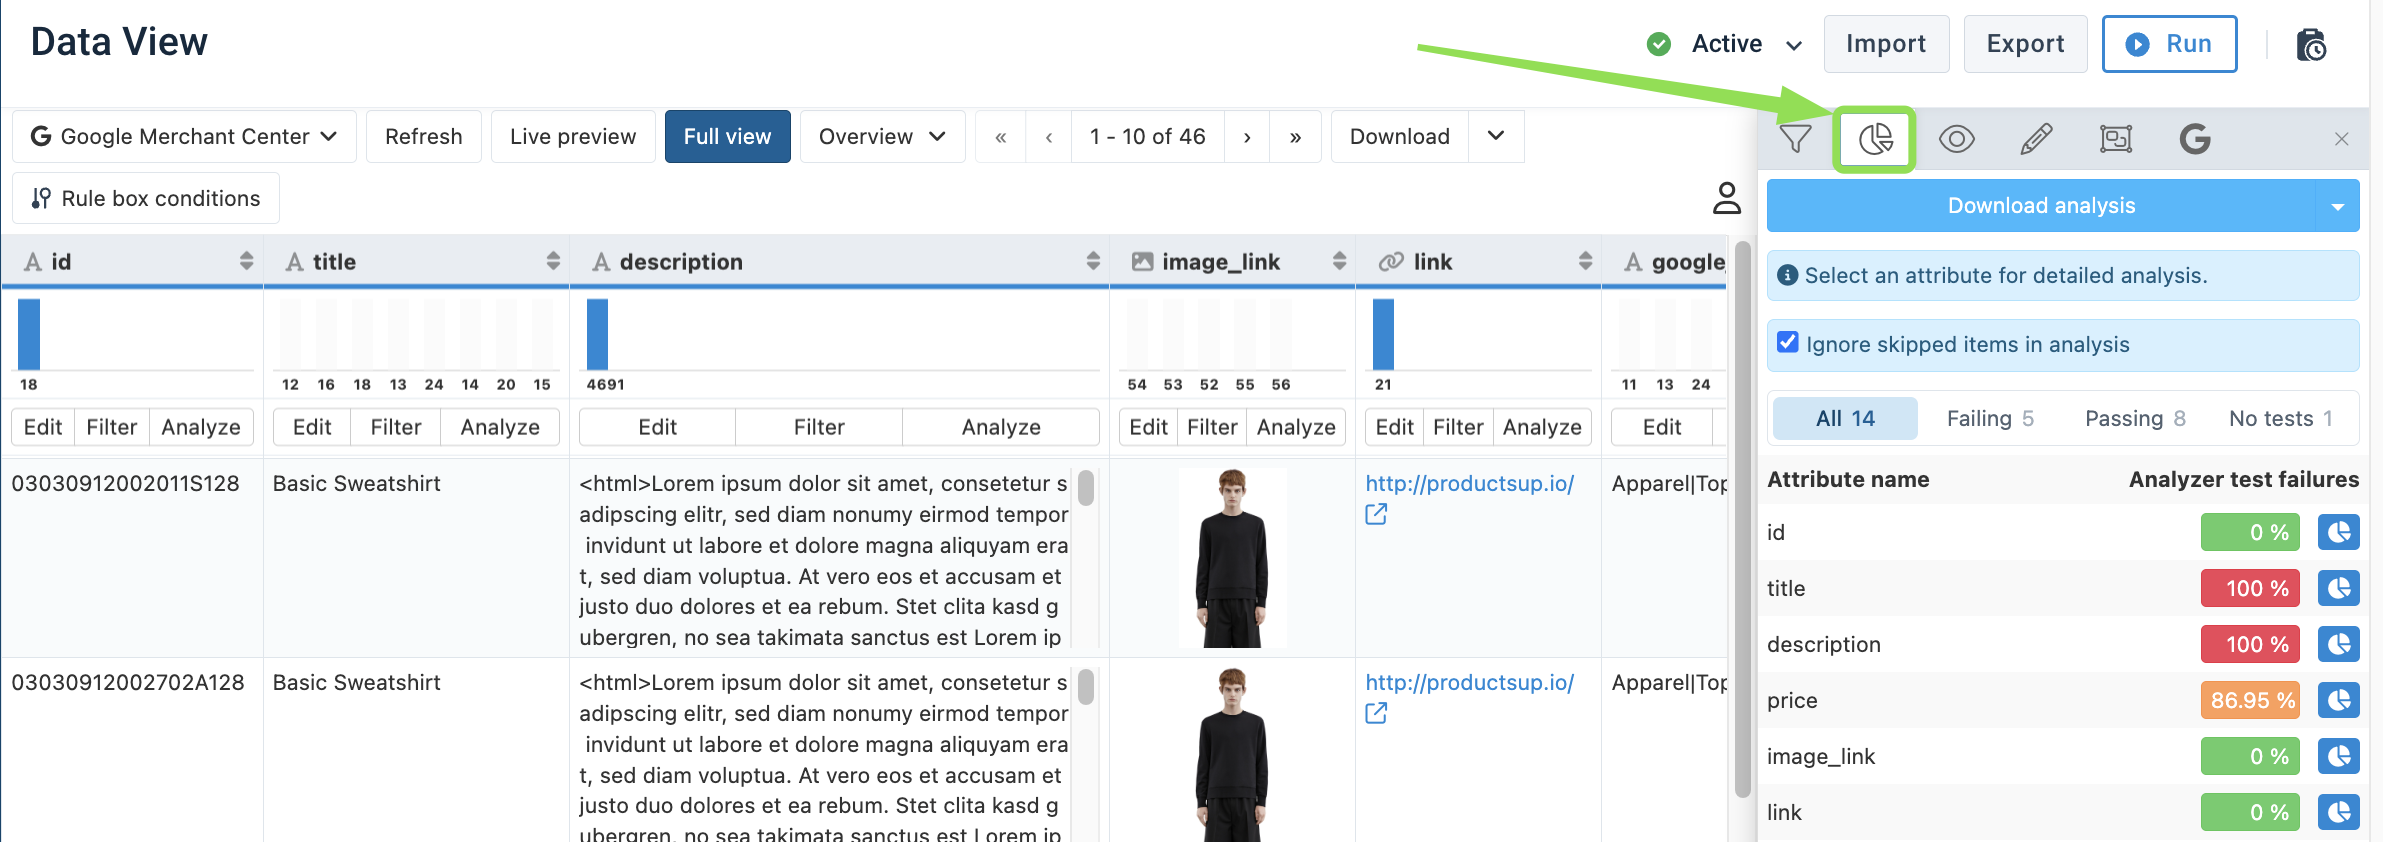
You can use quick filters: All, Failing, Passing, No tests.
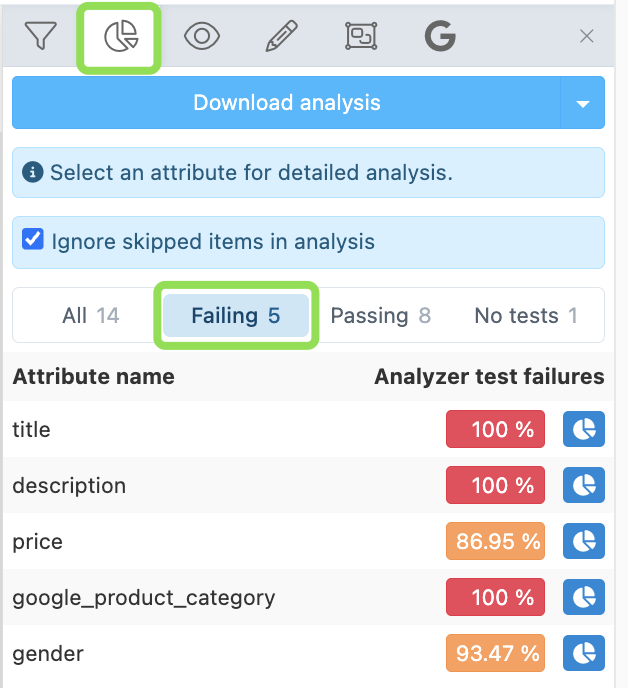
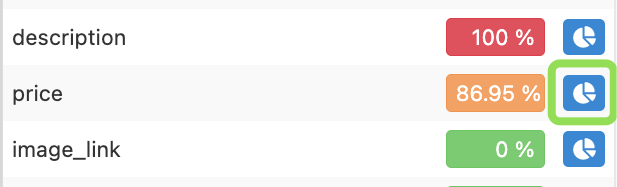
Click upon the "pie-chart" icon next to the attribute of interest to see its individual analytics.
Tip
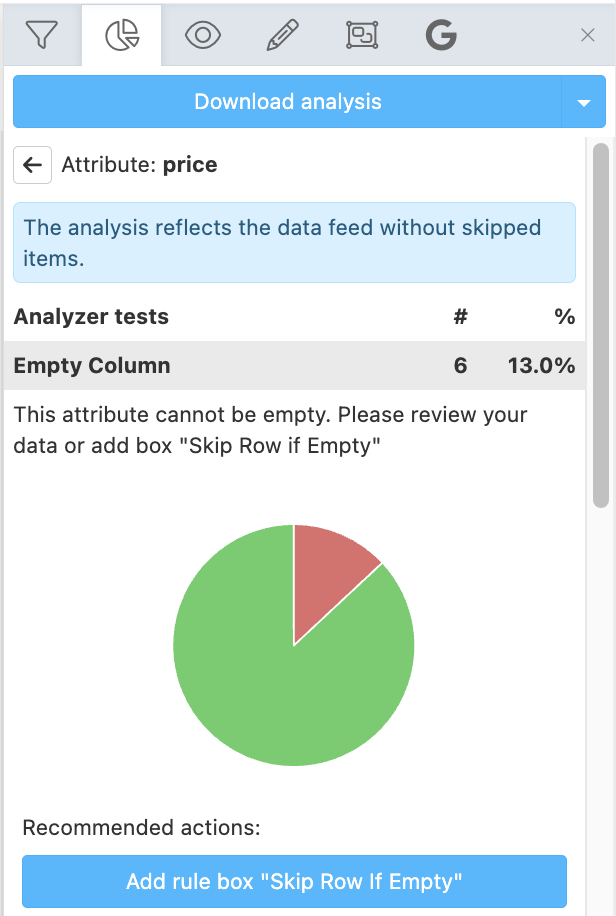
Not all attributes in each export have Analyzer tests defined (see the relevant section). But if they do, then Analyze menu shows the percentage of failed/passing analyzer tests per each attribute.
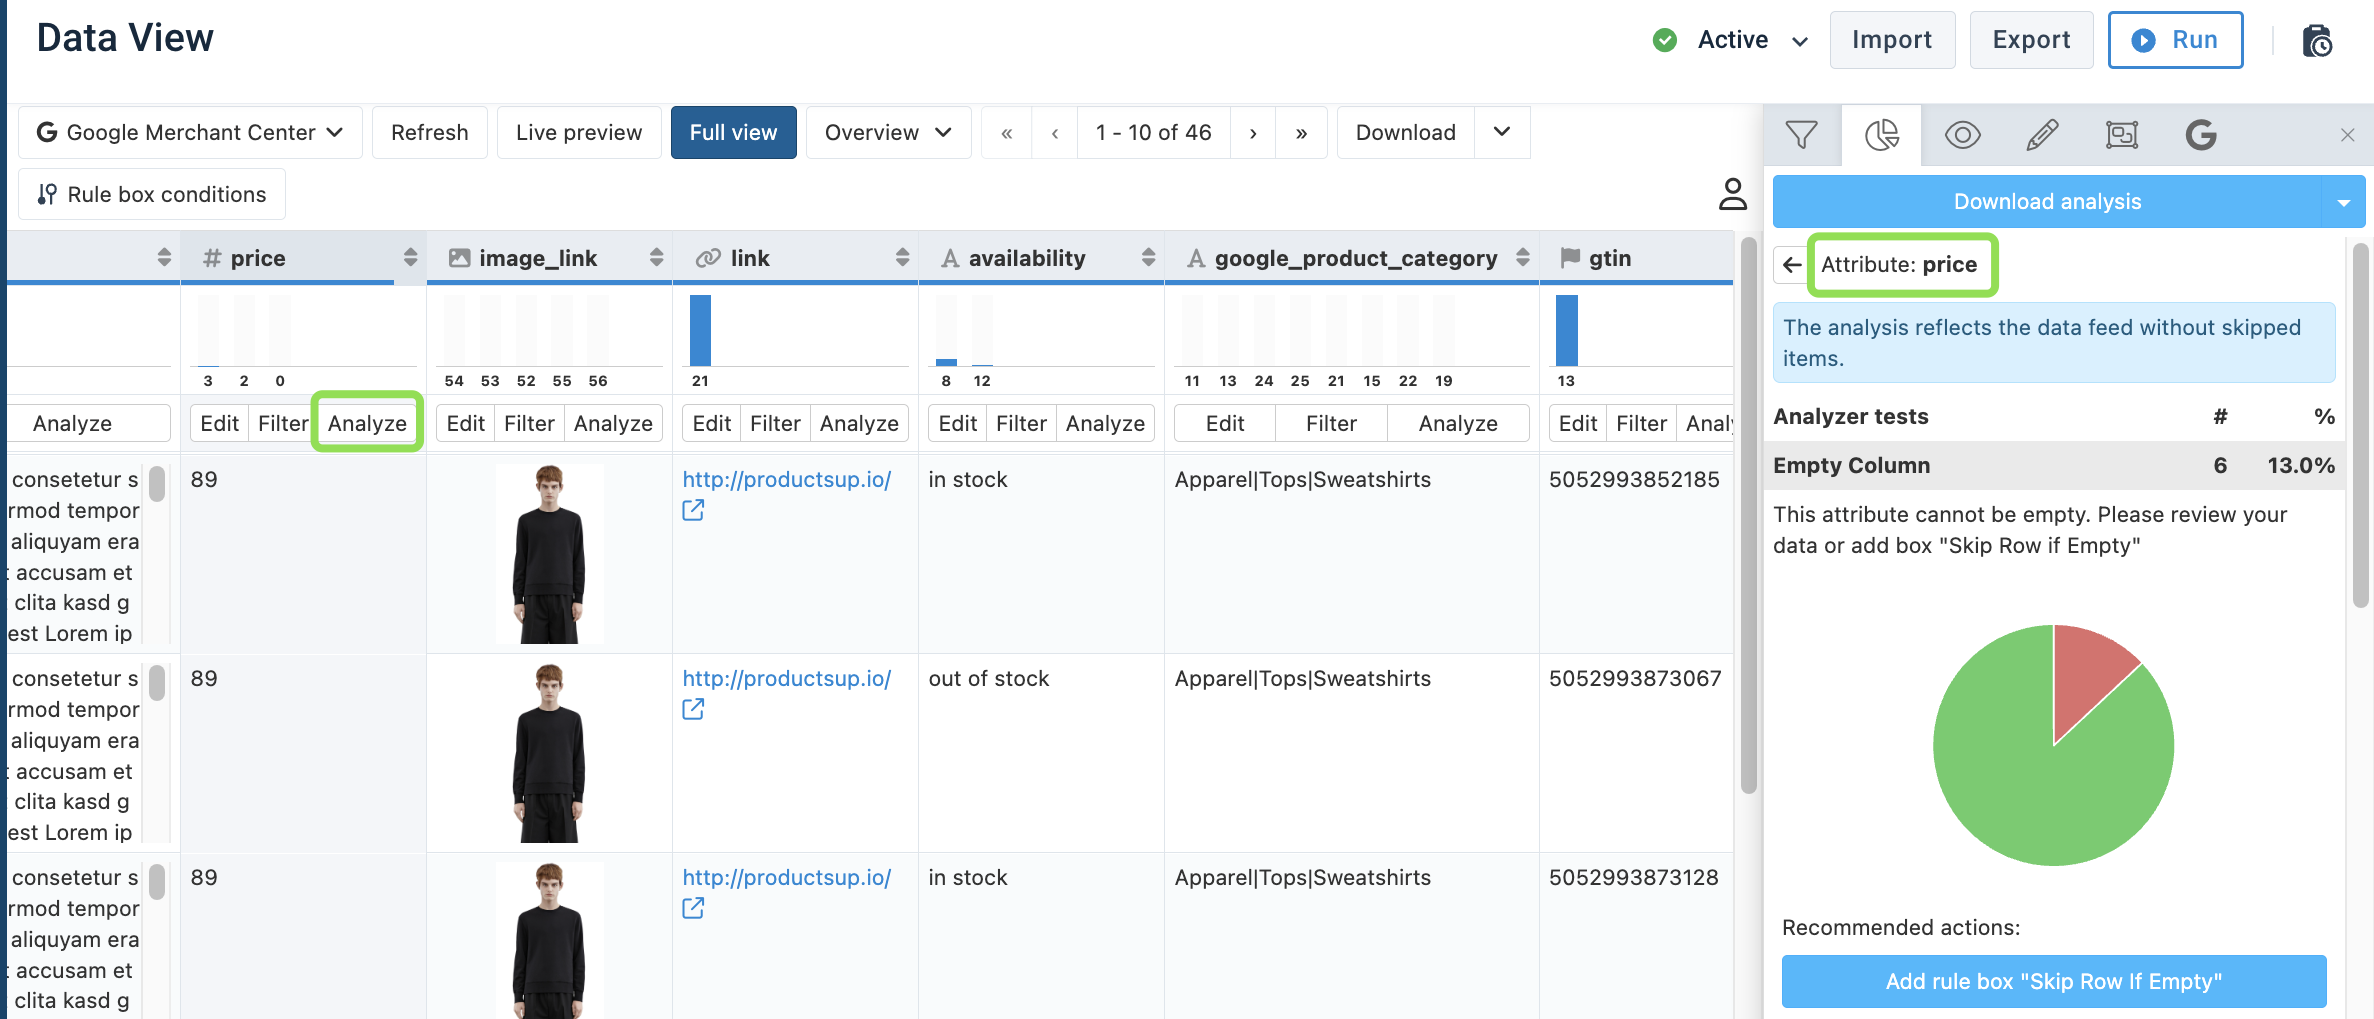
Access the Analyze attribute button
Go to Data View and select the needed stage or export from the dropdown on the left.
Find the needed attribute and choose Analyze under the attribute name.
2. Analyzer tests
This section describes how we present multiple Analyzer tests results - passing and failing - in the Data View. If you are curious to learn how we assign Analyzer tests to attributes in exports, please see Analyzer tests in Export Template Management.
Once you access Analyze menu details for the desired attribute, you can assess the following data:
Analyzer tests
Analyzer tests section displays multiple Analyzer tests results. For example, RegEx Patter Validation, Empty Column, Contains HTML, etc. This always depends on what a channel requires per each attribute.
Each Analyzer test details cover:
- test name or title;
- broader description or hint how to optimize the data;
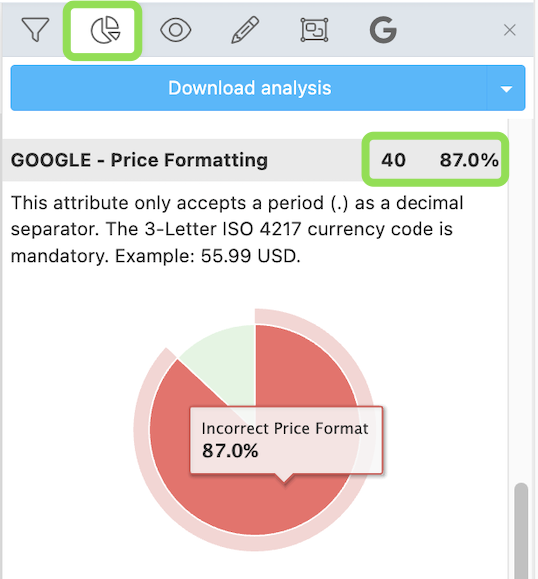
- clear indication of a Number and a Percentage (%) of products failing this test;
- a visual "pie-chart" results view.
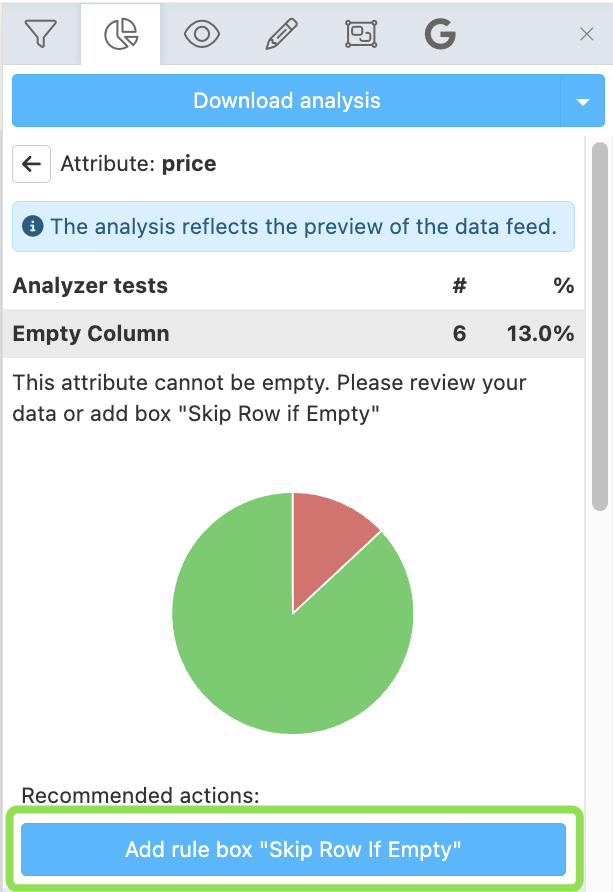
For the failing Analyzer tests, you can transform the data using the suggested Rule box right there, in the respective Analyzer tests section. For example, if you select Add box: "Skip Row if Empty", the platform adds the Skip Row if Empty rule box to the attribute at the export stage and sets it up as recommended.
Analyzer tests section is only available at the Export stage and appears in Analyze if the chosen export has analyzer tests assigned. This effectively means that the platform knows the requirements of that export channel and tests the data against those requirements. For example, the Google Content API for Shopping export uses analyzer tests, while Blank Export (empty) doesn't.
Attribute insights
Attribute insights section presents default analytics per each attribute, even if no Analyzer tests assigned. They are calculated and displayed at all times.
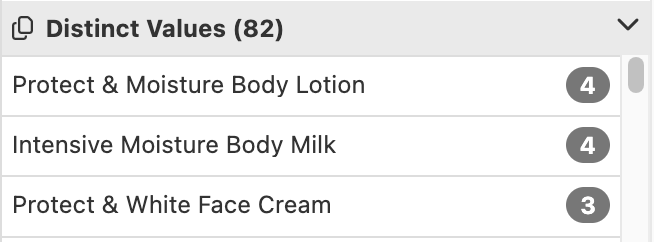
- Distinct Values This section shows the total number of unique values in the attribute and how many times each unique value appears.
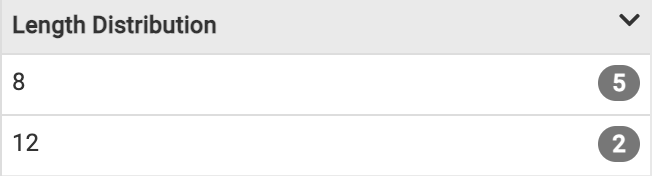
- Length Distribution This section analyzes the length of each value in the attribute, lists all length variants, and shows how many values have the same length.
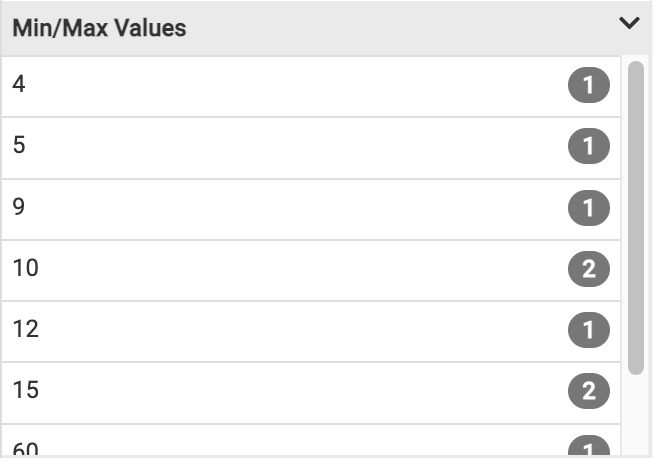
- Min/Mix Values This section arranges all the unique values in a number attribute from minimum to maximum and shows how many times each unique value appears.
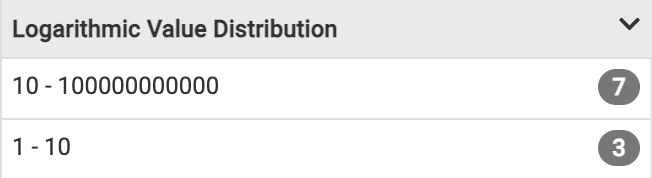
- Logarithmic Value Distribution This section splits all values in a numeric attribute into intervals, or buckets, and shows how many values there are in each bucket.
- % Empty This section shows the percentage and number of empty values in the attribute. In the following examples,
0.00 %means you don't have any empty values in this attribute, and100.00 %means all7values in the attribute are empty.

- Average Length This section calculates the average number of characters in the values. You should hover over the blank space under the section's title to see the calculated average length.

- Average Value This section calculates the average number based on the numeric values in the attribute. For example, if you have two (2) items with values 20 and 22 in the analyzed attribute, the average value is
21. You should hover over the blank space under the section's title to see the calculated average value.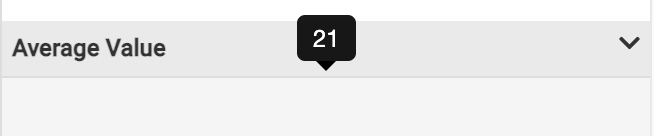
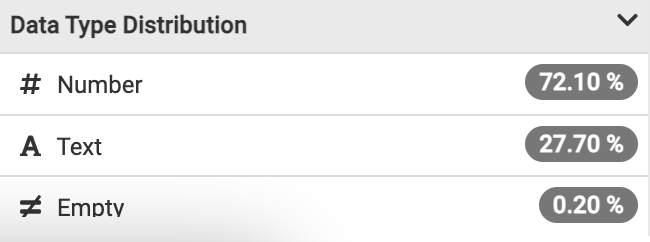
- Data Type Distribution This section shows the type of data stored in the attribute, such as images, text, URL, numbers, or empty values.
Tip
If you select a pie-chart or a row in one of the Analyzer sections, Data View creates a filter and displays only the items featured in the selected pie chart or row.
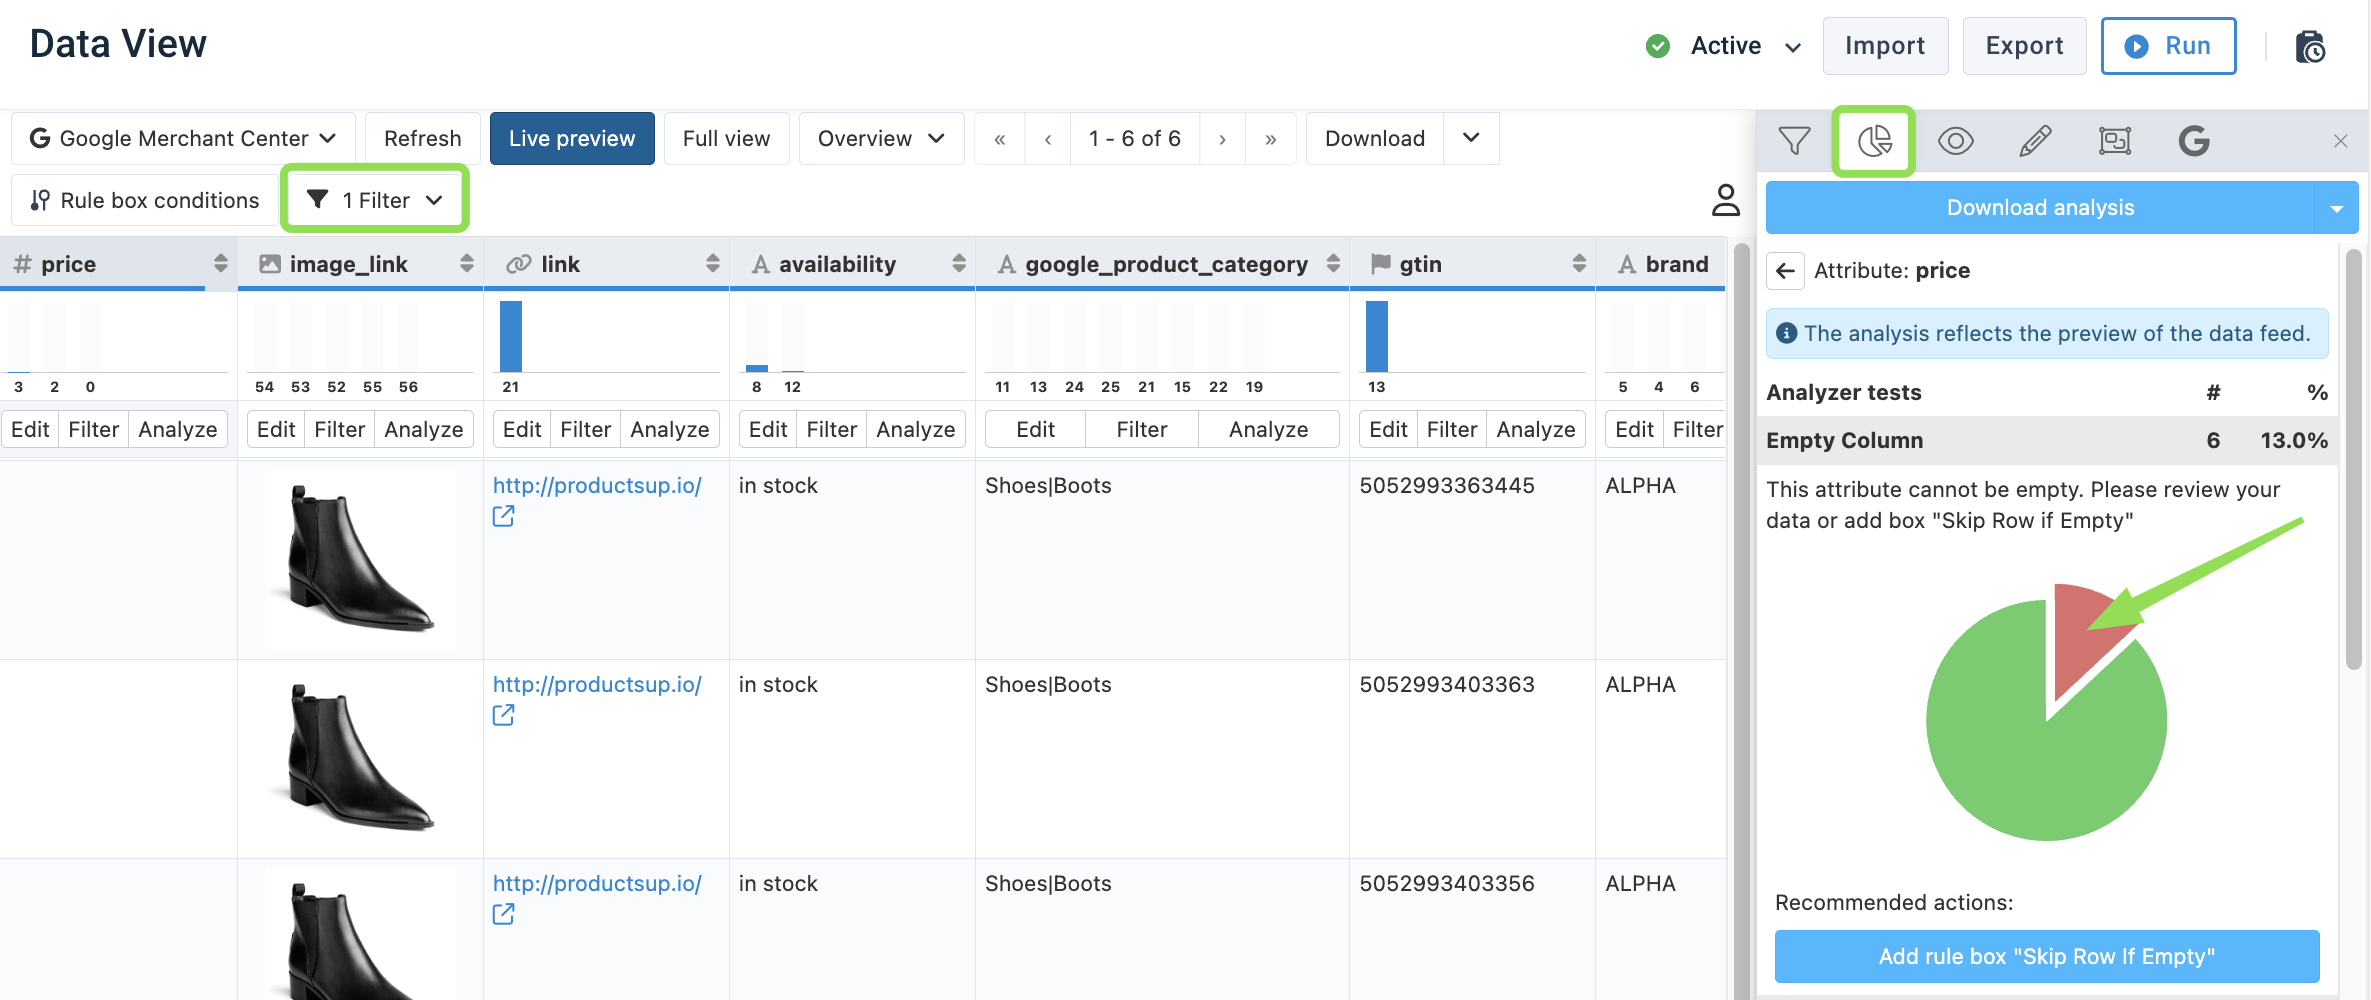
The sections in Analyze vary depending on the data type of the analyzed attribute. For example, the set of sections in Analyzer of the numeric values attributes differs from the image or text attributes.
2. Readiness score
Readiness score is a view option at the export stage in Data View that shows how many mandatory attributes are export-ready. It is available only for exports that use analyzer tests.
To access and use the core readiness score, you need to:
Go to Exports, add, and set up an export that uses analyzer tests.
Go to Dataflow, select the added export in the dropdown on the left, and map all mandatory attributes from import to export.
Go to Data View, select the needed export in the dropdown on the left, and choose Readiness in the Overview dropdown.
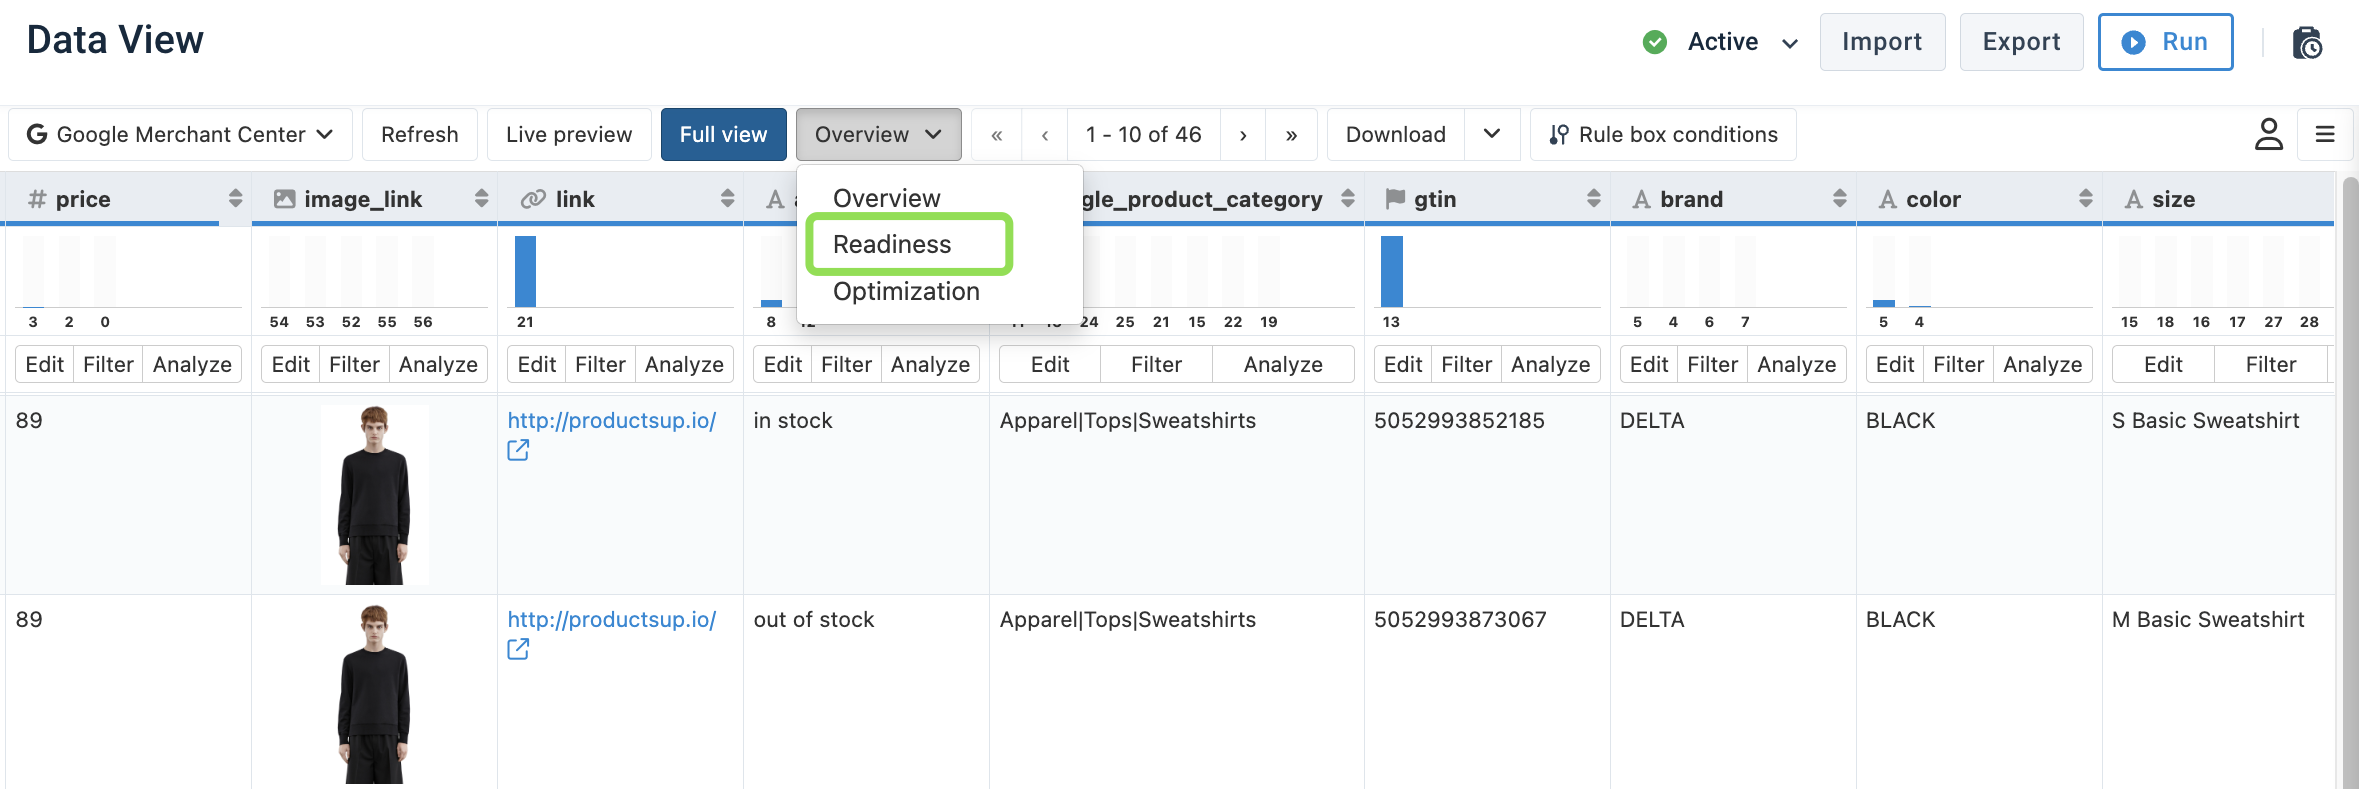
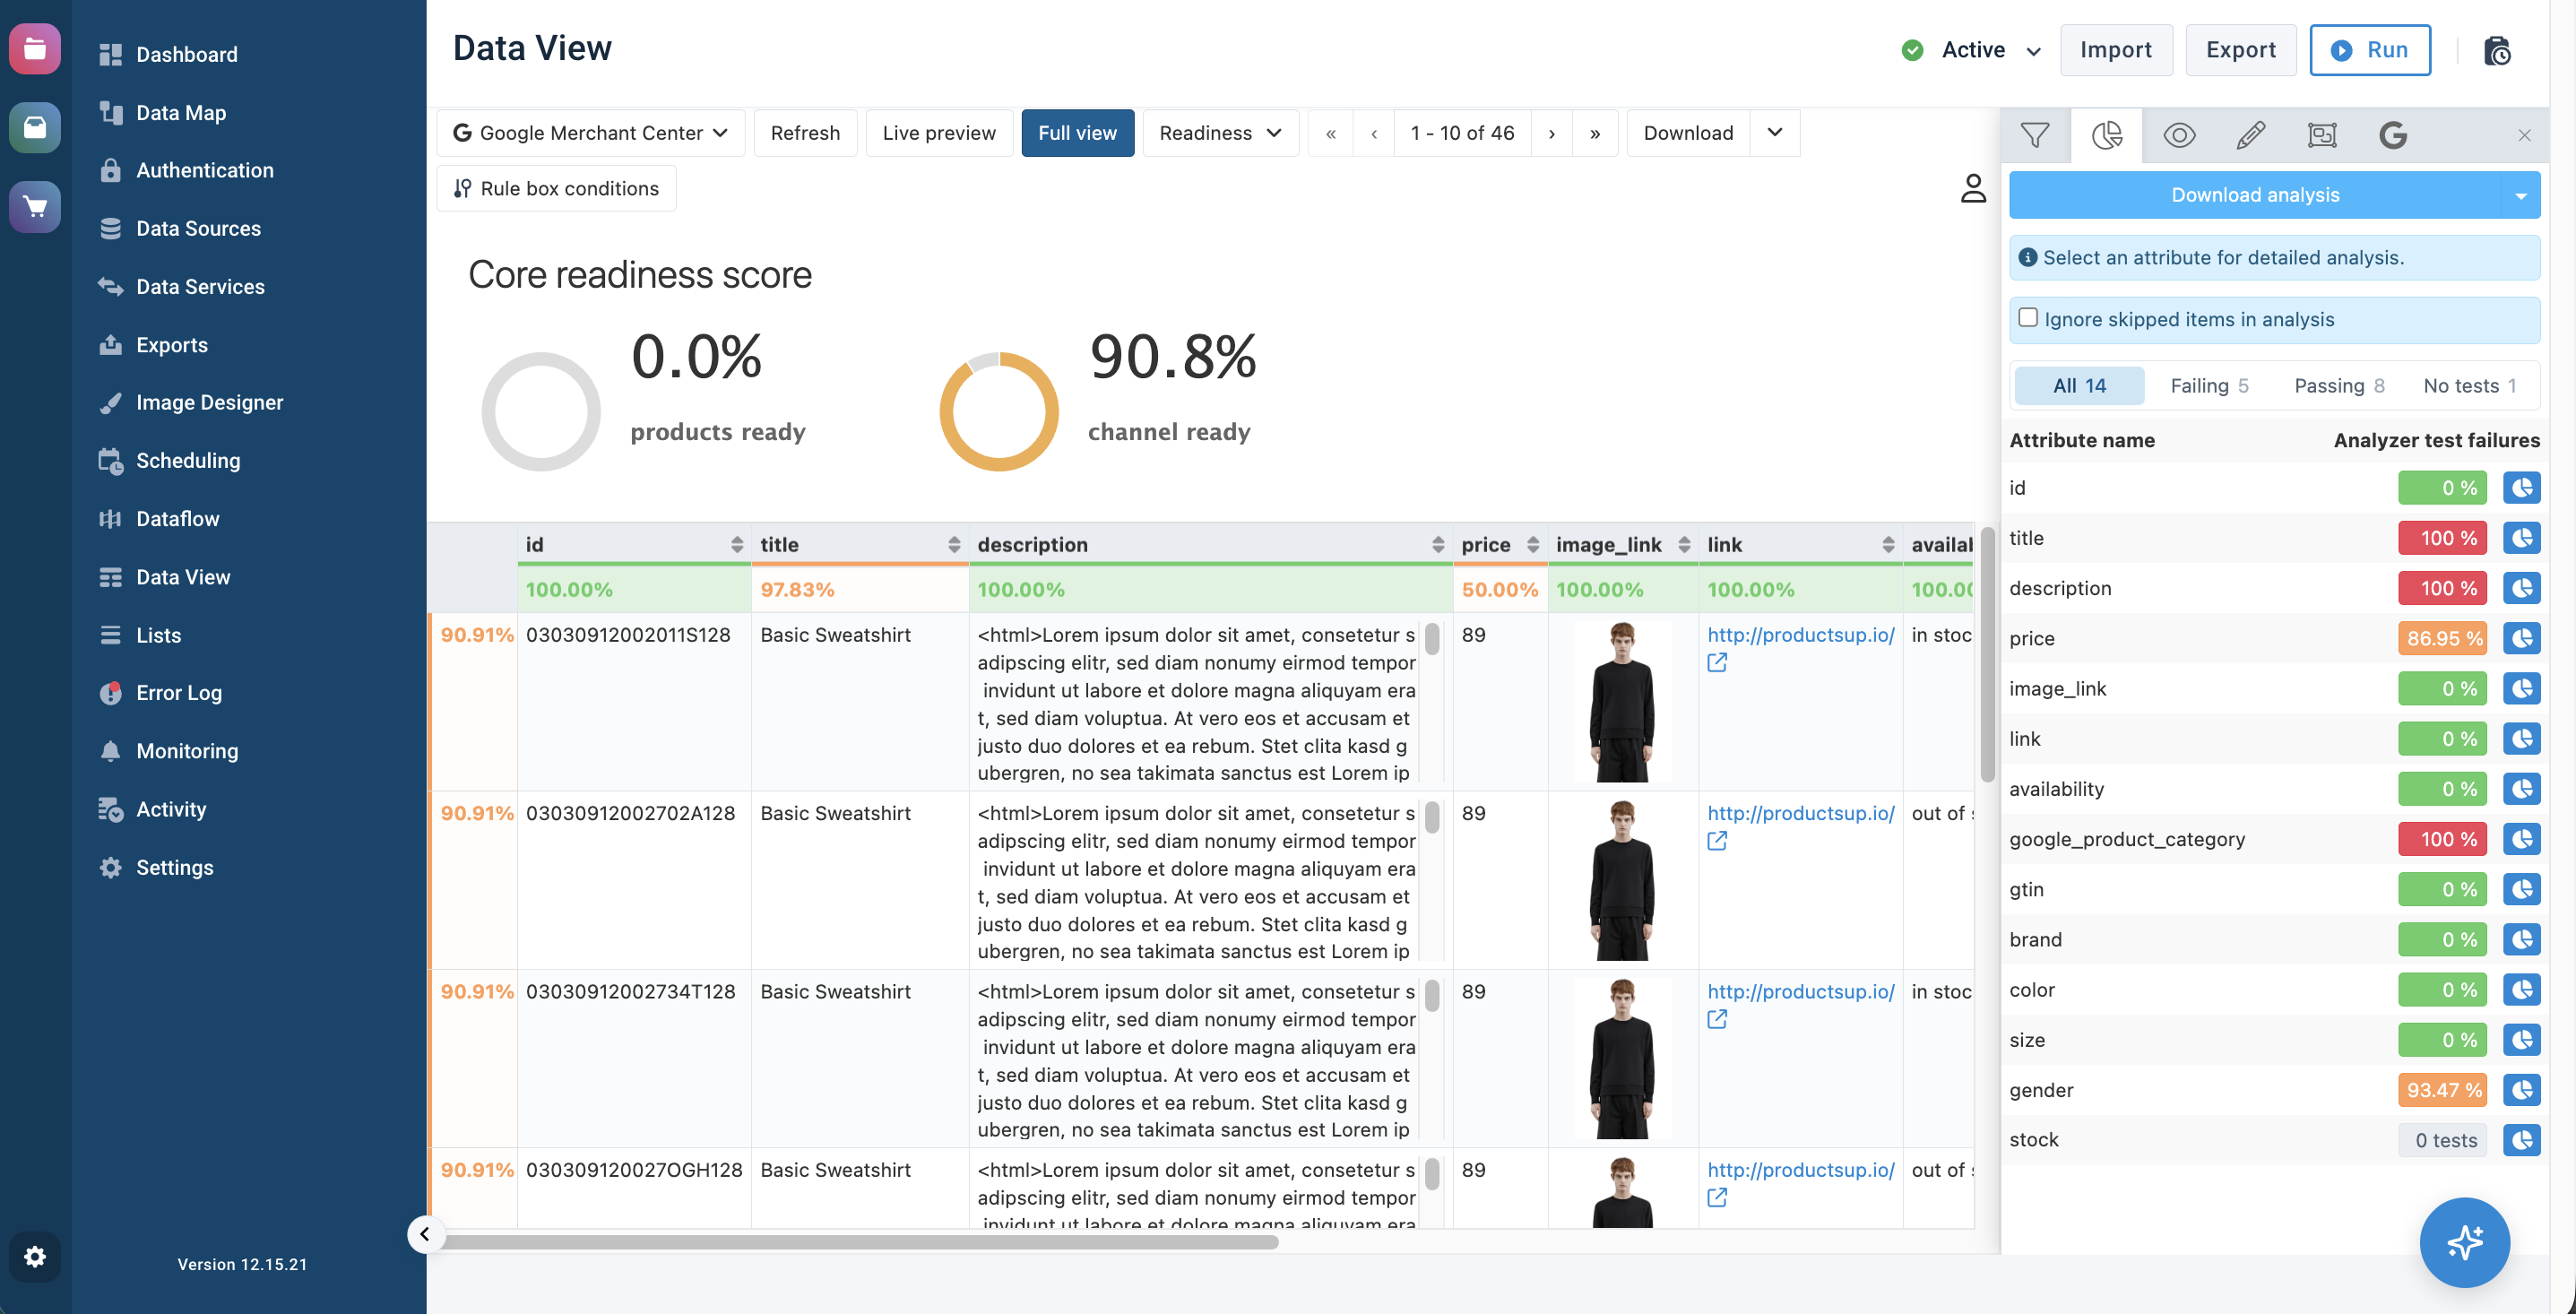
The Core readiness score appears at the top of the page:
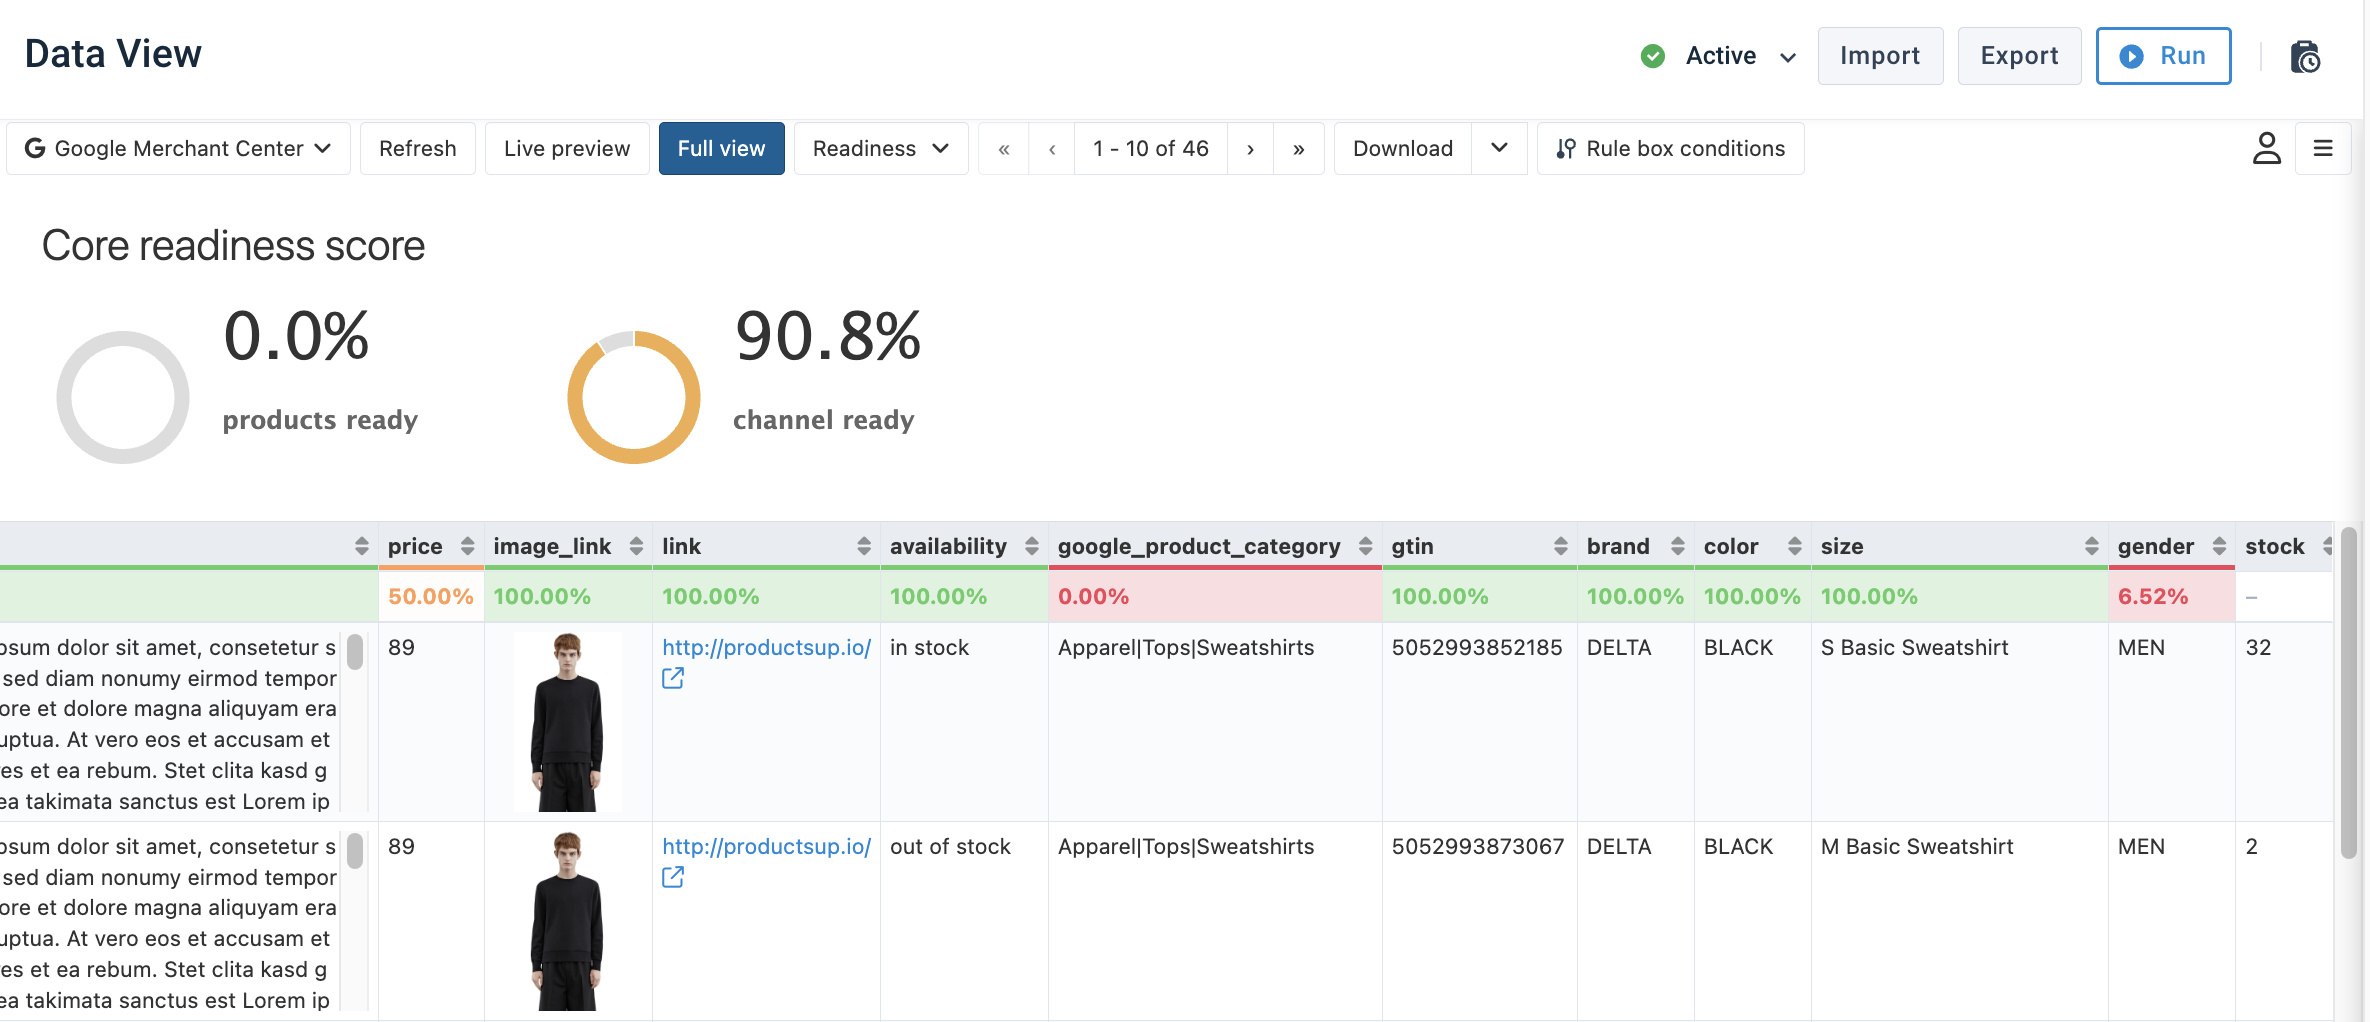
- The products ready figure shows the overall percentage of export-ready items whose mandatory attributes meet the requirements of the target channel. In the screenshot above,
0.0%items are ready because all items have issues with several values in theid,title, and other attributes highlighted in orange. - The channel ready figure shows the average percentage of how many mandatory attributes are export-ready per item. In the screenshot above,
89.8%is an average percentage of the mandatory attributes ready for export per item.
To help you identify issues, the platform highlights the ready attributes in green and the problematic ones in orange or red. It also displays the percentage of values meeting the channel's requirements under each attribute name. If you select the readiness percentage under the attribute name, the Analyzer feature opens on your right.
3. Optimization score
Optimization score is a view option at the export stage in Data View that shows how many mandatory and optional attributes are export-ready. It is available at the export stage only for exports that use analyzer tests.
To access and use the enhanced readiness score, you need to:
Go to Exports, add, and set up an export that uses analyzer tests.
Go to Dataflow, select the added export in the dropdown on the left, and map all relevant attributes from import to export.
Go to Data View, select the needed export in the dropdown on the left, and choose Optimization in the Overview dropdown.
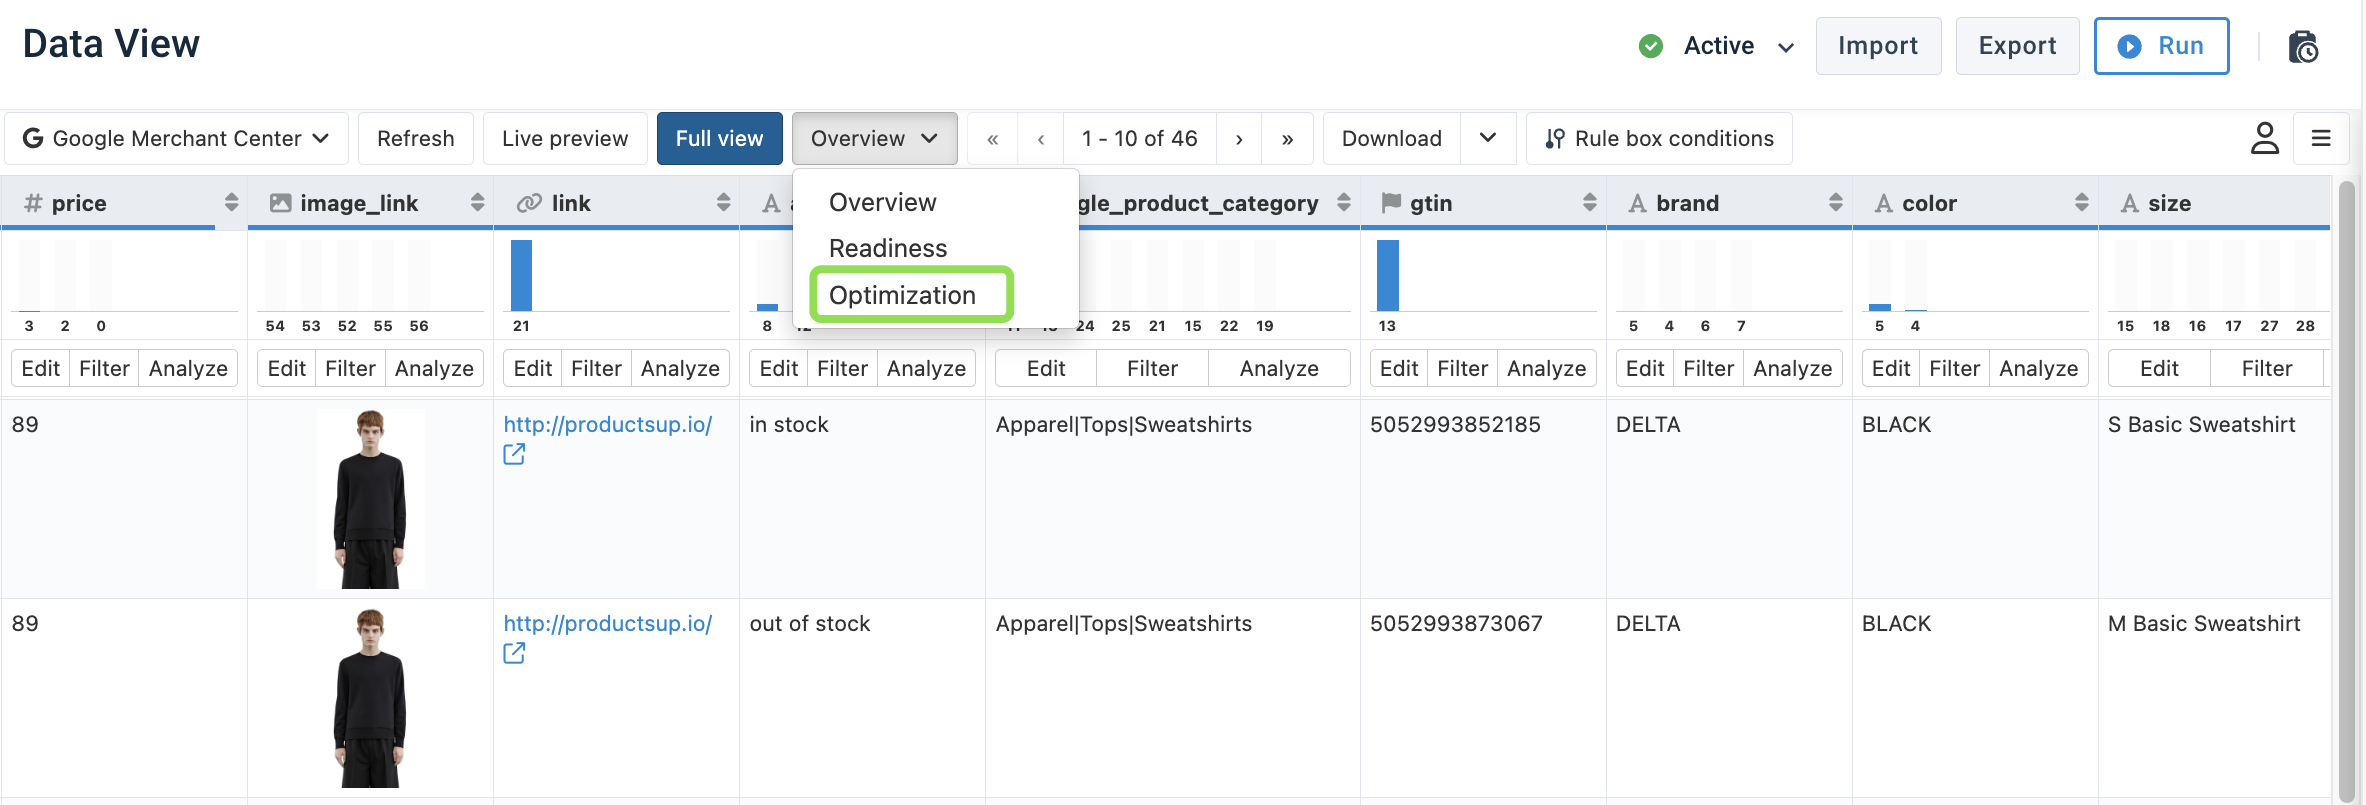
The Enhanced readiness score appears at the top of the page:
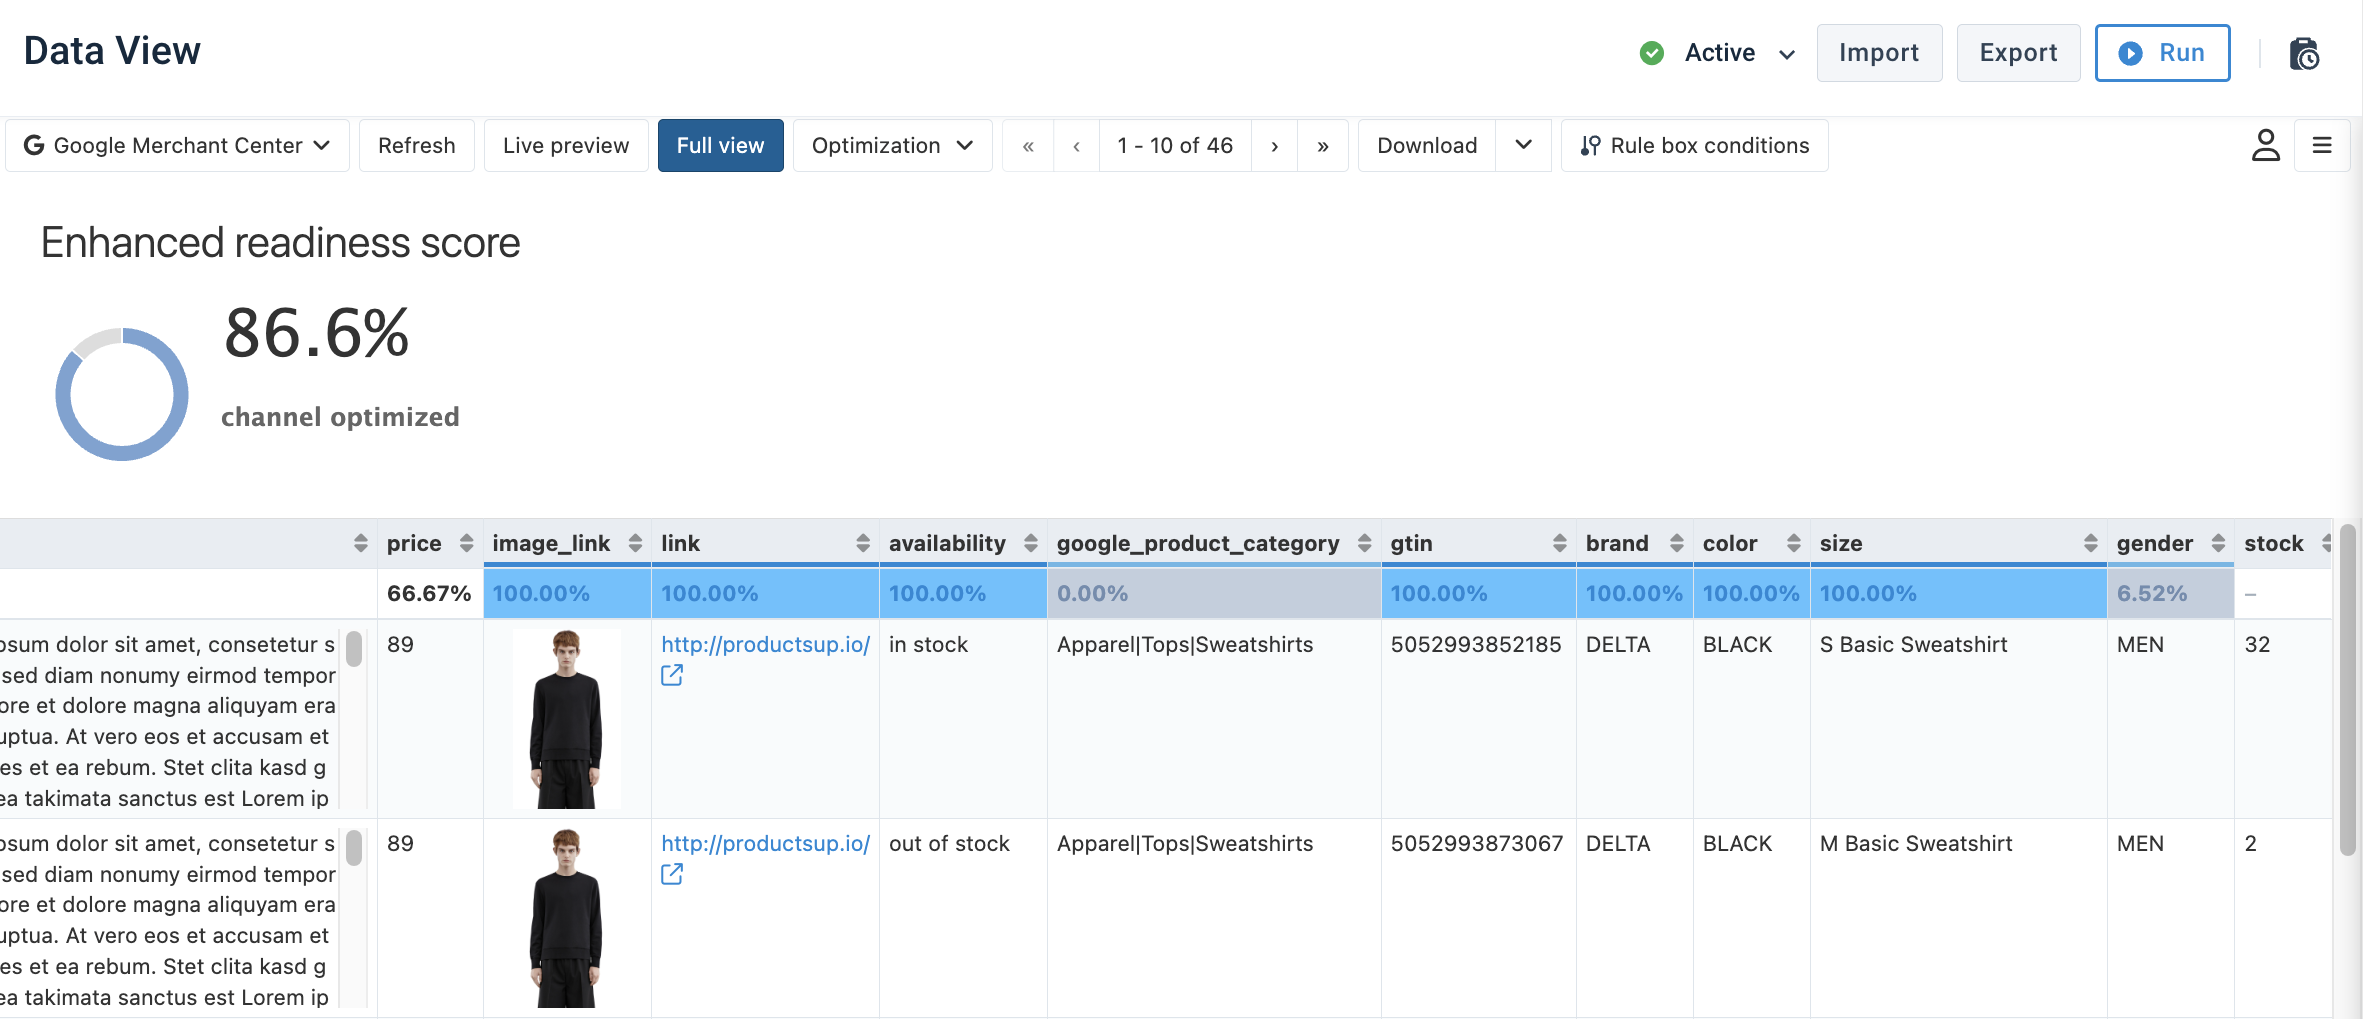
- The channel optimized figure shows the average percentage of how many attributes are export-ready per item. In the screenshot above,
86.1%is the average of all attributes ready for export per item.To help you identify issues, the platform displays the percentage of an item's attributes that meet the channel's requirements at the start of each item row on the left. It also highlights the ready attributes in blue and the problematic ones in white or gray. You can find the percentage of values meeting the channel's requirements under each attribute name and select it to open the Analyzer feature on your right.
4. Get your attribute data ready for export
You can use all the data quality analysis features in Data View to get your data ready for export. We recommend the following process to analyze and optimize your data:
Once you add and set up all your needed data sources and exports, go to Dataflow to map all relevant attributes from import to export.
Go to Data View, select the needed export in the dropdown on the left, and choose Readiness in the Overview dropdown.
When you identify what attributes and items require your attention, open the Analyzer feature using the context menu or the readiness percentage under the needed attribute name.
Apply the recommended rule boxes right in Analyzer or add them manually. See Add a rule box for more information on adding rule boxes.
If you want to optimize and send both mandatory and optional attributes to your target channel, choose Optimization in the Overview dropdown in Data View and repeat see the relevant section and see the relevant section using the channel optimization data.
5. Download reports with data quality analysis
You can download reports in Data View. For example, you can share the results of attribute data analytics with a colleague who doesn't have access to Productsup.
In Data View, you can create and download the following reports:
- Download analysis creates a list of all analyzer tests performed with your attribute data and collects the results of those analyzer tests in a CSV file. The file displays all subsections of the Analyzer Tests section for all your mapped attributes.This report is available at the export stage only.
- Download attribute insights creates a CSV file with a list of all Analyzer sections, such as Distinct Values, Length Distribution, % Empty, etc., and the related value data stats, excluding the Analyzer tests section.This report is available at all stages of your site.
- Download enhanced readiness score summarizes the overall export readiness of your mandatory and optional attributes as an HTML page that displays the enhanced readiness score of your export. The report isn't available at a unique URL, so you can't share it using a link to that HTML page. You need to download the report file to share it.This report is available at the export stage only.
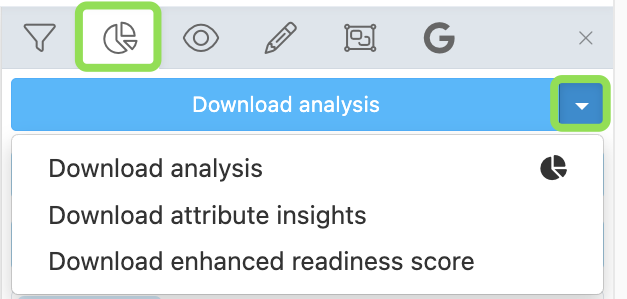
Follow these steps to download an attribute data analytics report:
Go to Data View from your site's main menu.
In the dropdown on the left, select the needed export.
Open the context menu on the right and select the pie-chart icon.
In the Download Analysis dropdown, select the downwards triangle icon (▾) and choose your report type:
- Select Download Analysis to download a report with analyzer tests.
- Select Top Values to download a report with all Analyzer sections, excluding Analyzer tests.
- Select Download Enhanced readiness score to download a report with an enhanced readiness score.A new tab opens in your browser with a report presented as an HTML page. Use the functionality of your browser to print or download the report.
Tip
You can create reports using the options Download attribute insights and Download enhanced readiness score to feature data on all attributes or a selected attribute only:
- To create a report on all attributes, follow the procedure described above.
- To create a report about a single attribute, follow the procedure described above, but instead of performing see the relevant section, select Analyze under the needed attribute name.
How is this guide?