Visualize your data in Data View
Visualize your data in Data View in Productsup.
Introduction
Data View is the platform area where you can view and edit your data with rule boxes and check whether it's ready for export.
Tip
See Analyze your data in Data View to learn how to use Analyzer in Data View.
See Use Dataflow to map your attributes from import to export to learn how to map your data.
The upper ribbon on the Data View contains features that help you adjust your view:
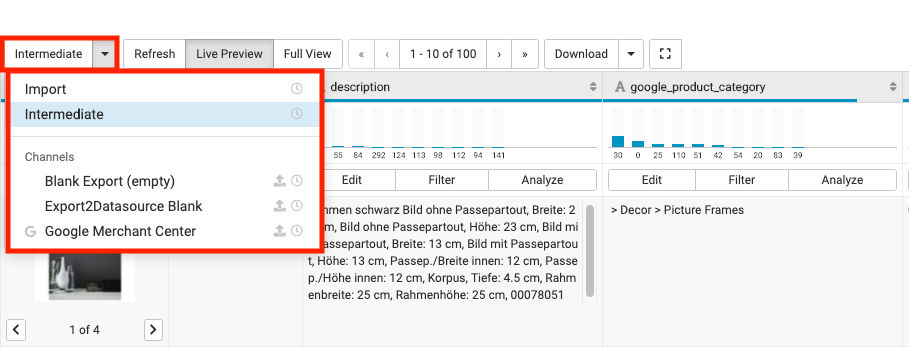
Export selection lets you select the import or intermediate stage or one of the exports added in Exports.
Live Preview and Full View are two options to display the changes after applying a new mapping or editing data with rule boxes.
Product number selector lets you customize the number of visible products per page.
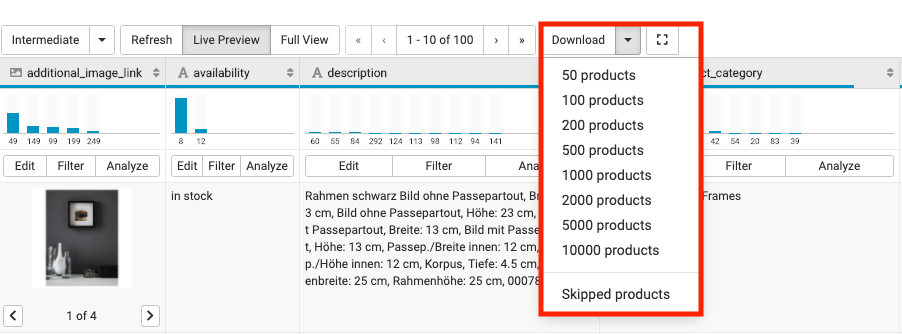
Download lets you download products from Data View into a CSV file.
Rule Box Conditions lets you create and set up conditions to determine when the platform should apply rule boxes to an attribute.
User icon lets you see the names of other users currently working on the same data.
Menu icon opens the side panel that contains attribute visibility features that let you:
View your data in the relevant stage
To view your products in the import, intermediate, or specific export stage:
Go to Data View from the site's main menu.
Choose the stage or export you wish to view in the drop-down menu in the upper ribbon.
Check the data changes with Live Preview or Full View
You have two options to see the changes after applying a new mapping or editing data with rule boxes.
Live Preview shows you up to 10.000 products for the import stage and 1000 for the intermediate and export stages. With Live Preview activated, the platform refreshes Data View automatically whenever you change your data by applying new mappings or rule boxes.
Full View shows you all the products. With Full Preview activated, you must refresh the Data View manually. Alternatively, you can see them after your site processes the changes through scheduling or after you trigger Import or Export.
You can toggle between the Live Preview and Full View:
Go to Data View from the site's main menu. The platform highlights the active view.
In the top ribbon, select Live Preview or Full View.

Note
If you choose Full View, select Refresh on the left-hand side of the Live Preview to see the data changes.
Customize the number of visible products
Go to Data View from the site's main menu.
Customize the number of products you wish to see per page:

Download products directly from Data View
You can download products from Data View into a CSV file.
The CSV file lets you check certain products without downloading an entire export feed.
Go to Data View from the site's main menu.
In the top ribbon, expand the Download drop-down menu.
Select the number of products you wish to download.
The platform downloads a CSV file to your computer.
Note
You download every attribute column visible in Data View.
Download more than 10,000 products
The platform lets you download a maximum of 10,000 products. If you need to download only specific attribute columns and more products, use Blank Export (empty):
Go to Exports from your site's main menu and select ADD EXPORT.
Select Blank Export (empty) in the gray banner.
Go to Dataflow from your site's main menu and select your Blank Export (empty) in the Export selection drop-down menu.
Connect only the attributes you want to download and ensure they don't contain any skip rules.
Optionally, go to Data View and ensure you've added all the necessary attributes.
Go to Exports again.
Select the added export.
Select Add Destination and choose Productsup Server.
Select Export this export in the top-right corner of the page to send your data to the destination. Alternatively, the platform exports the data during the next scheduled run.
Scroll down to the Filename section and find your export feed link. Select it to download the feed.

Note
If the file is red after the end of the processing, reload the page.
View users working currently on the same data
To see if other users are working on the same data and escape any conflicts in data optimization:
Hover over the user icon
 in the right corner of the upper ribbon and see the active users' names.
Customize the visibility of the attributes in Data View
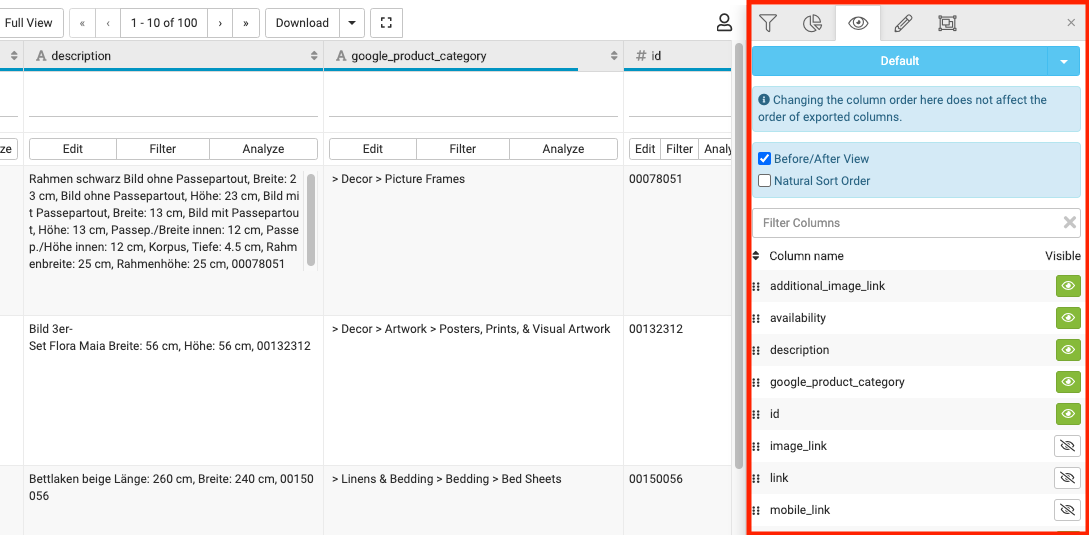
You can choose the attribute columns you want to see in Data View.
Go to Data View from the site's main menu.
In the toolbar on the right-hand side, select the eye icon
 .
.Select the eye icons
 next to the attribute names to make them visible or invisible.
Change the attributes order in Data View
To customize the order of the attributes in Data View:
Go to Data View from the site's main menu.
In the toolbar on the right-hand side, select the eye icon
 .
.Select the dots icon
 on the left of the attribute name and drag it to the desired position.
Note
Reordering the attributes affects only Data View. To change the order of the attributes in your export file, see Add export.
Display or hide all attributes
To show or hide the available attributes in Data View:
Go to Data View from the site's main menu.
In the toolbar on the right-hand side, select the eye icon
 .
.Select the blue arrow at the top of the toolbar.
Select Display All Columns to make all attributes visible or Hide All Columns to hide all attributes.
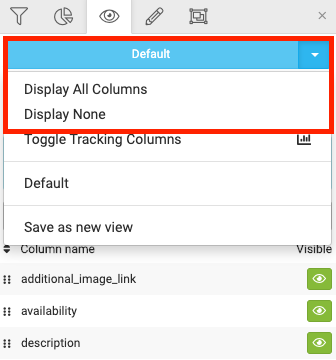
Display tracking attributes
To display all attributes related to tracking:
Go to Data View from the site's main menu.
In the toolbar on the right-hand side, select the eye icon
 .
.Select the blue arrow at the top of the toolbar.
Select Toggle Tracking Columns.
Use Before/After View to see product optimization changes
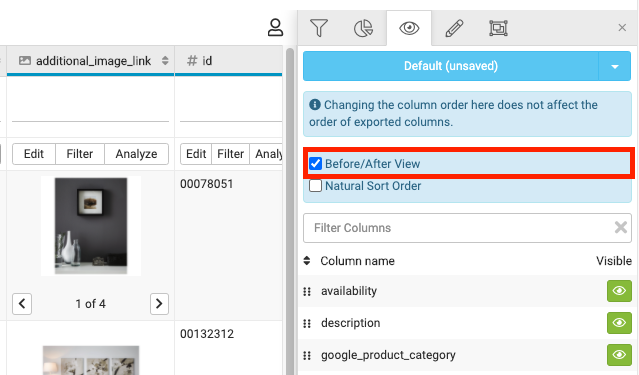
Before/After View displays any modification made with rule boxes in the Before and After columns for an attribute in Data View:
Go to Data View from the site's main menu.
In the toolbar on the right-hand side, select the eye icon
 .
.Check Before/After View.
Tip
If you don't see the Before and After columns after applying rule boxes in Data View, ensure you have set a unique item identifier in Data Sources. See Set a unique item identifier for more information.
Once you have set a unique item identifier, select Run or Import in the top-right corner of your site's view.
Save your customized Data View settings
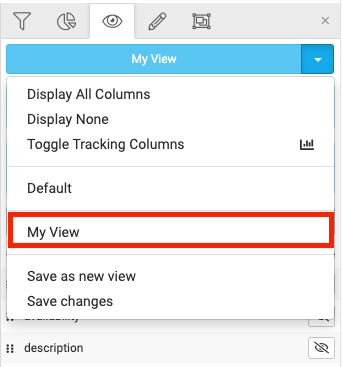
There is no need to change settings for Data View each time you log in to the platform. You can save your custom settings:
Go to Data View from the site's main menu.
In the toolbar on the right-hand side, select the eye icon
 .
.Customize your Data View settings.
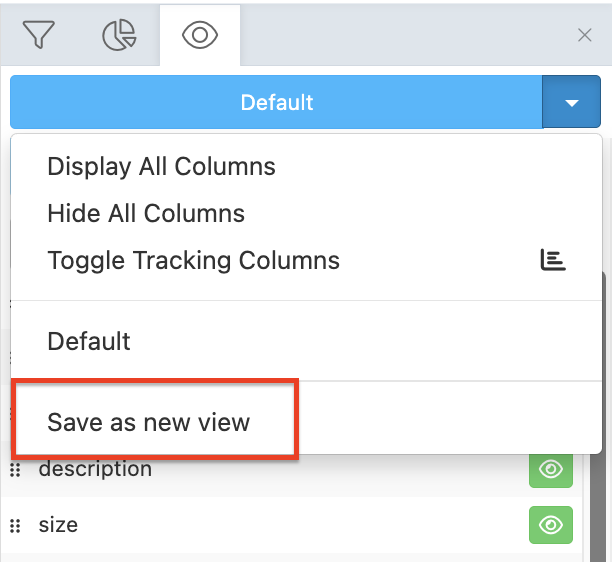
Select the blue arrow at the top of the toolbar.
Select Save as new view.
Give your view a name.
Select Save.
Your view is now available in the blue drop-down menu. You can also select the Default view in the menu to restore the standard Data View settings.
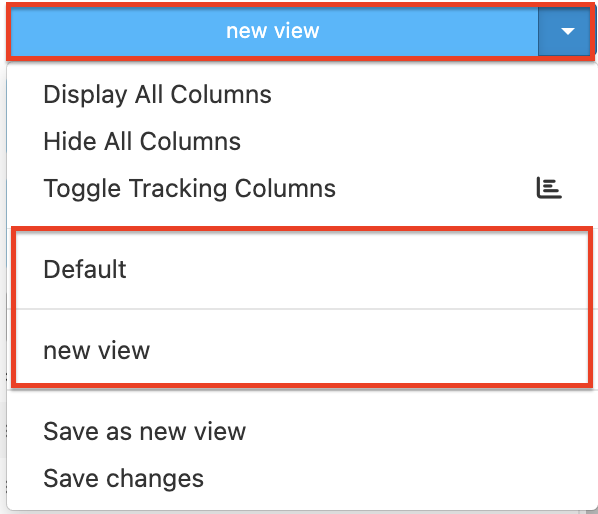
You can edit your view and select Save changes or Save as new view.
Use filters to find products by their attribute values
Apply filters to view specific subgroups of products. For example, you can find the products belonging to a particular category or only skipped products.
Use pre-defined filters
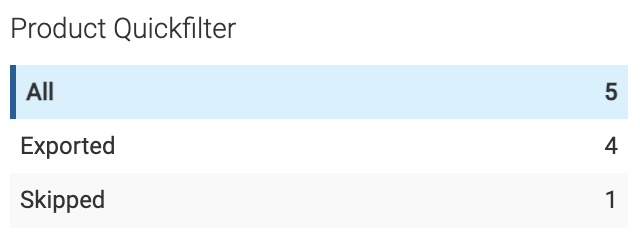
Use Product Quickfilter to see all, only exported, or skipped products. It is available at the intermediate and export stages.
Go to Data View from the site's main menu.
Select the intermediate stage or choose the needed export from the Export selection drop-down menu.
In the right corner of the upper ribbon, select the menu icon.

In the Product Quickfilter section, choose All, Exported, or Skipped to see only these products in Data View.
Find products that meet a condition
You can add a filter to search for products that meet a specific condition. Filters are available in all stages of Data View.
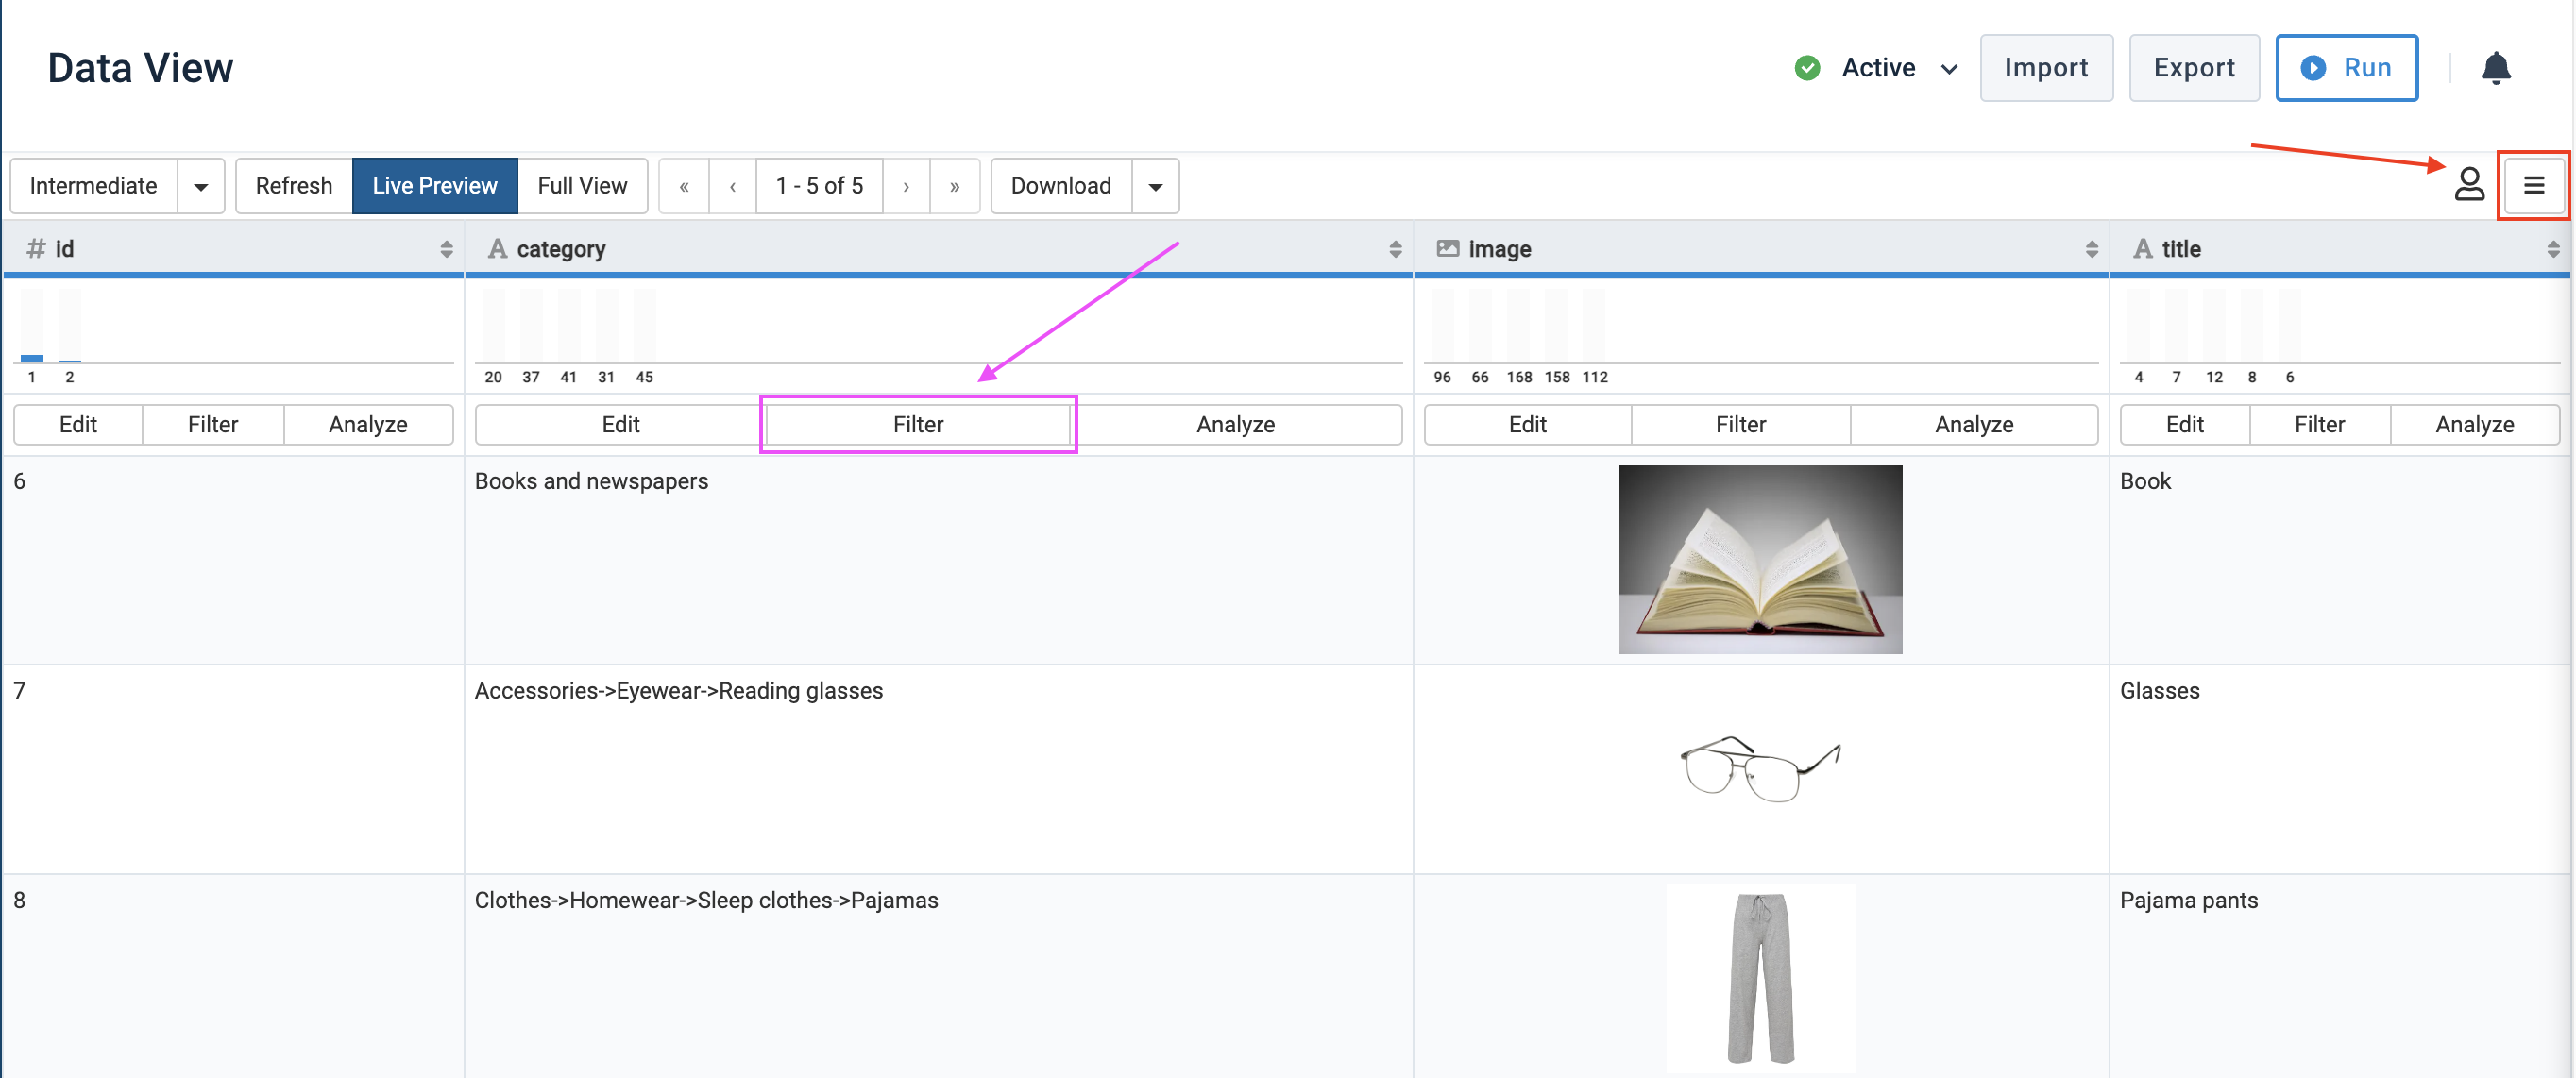
You can find filters in two places:
In the right-hand side toolbar that opens when you select the menu icon
 in the upper ribbon, as shown in red on the screenshot. See Add a filter from the menu.
In an attribute column by selecting Filter, as shown in pink on the screenshot. See Add a filter in an attribute column.
Add a filter from the menu
Go to Data View from the site's main menu.
Choose the needed stage or export from the Export selection drop-down menu.
Select the menu icon in the right corner of the upper ribbon.
In the first drop-down menu of the Add Filter section, select the attribute where you want to search.
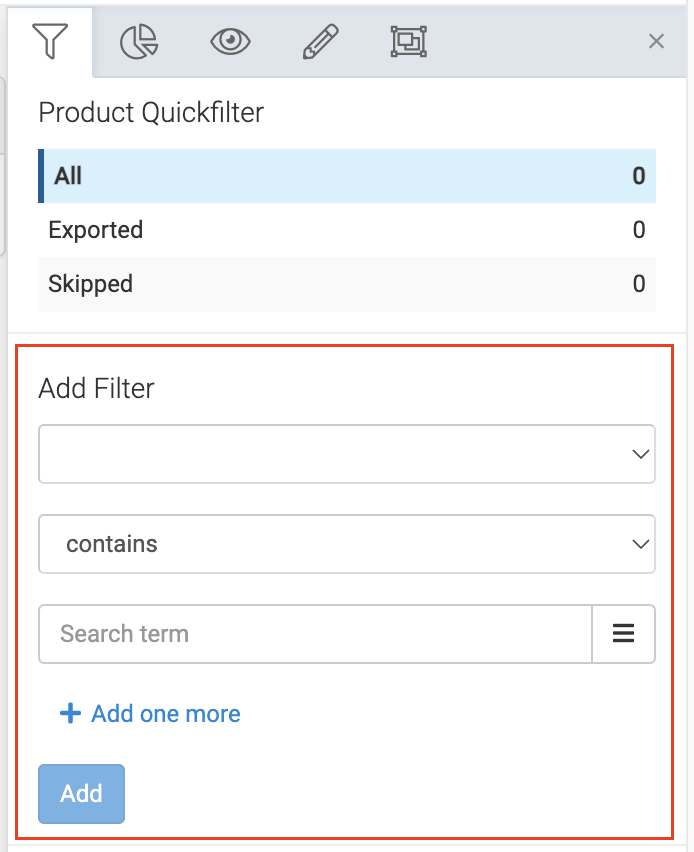
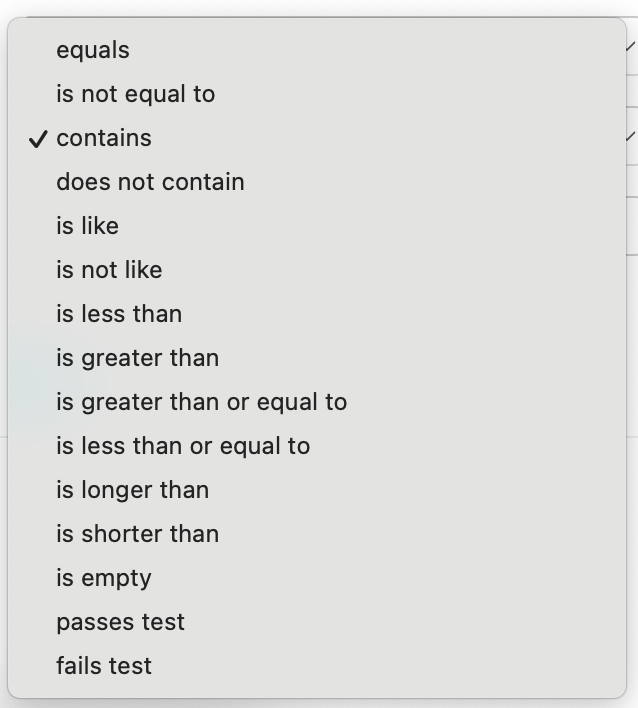
Select a filter option in the second drop-down menu.
Note
The passes test and fails test options are only available at the export stage and only for active exports. These options let you filter out the values that pass or fail the analyzer test in the selected attribute. Then, in the drop-down menu below, you must choose the analyzer test for that attribute.
In Search term, enter a value you are looking for or use the menu icon to sele from the attribute's values.
If needed, add another value by selecting + Add one more and entering the desired value in the field Or. You can remove the additional value by selecting the delete icon
 .
.Select Add.
It takes some time for Data View to refresh and show only the filtered products.
You can see a summary of your applied filter in the section Current Filter.
To restore the original Data View displaying all products, remove the applied filter by selecting the delete icon
 in Current Filter.
When you created a filter, you can see it as a Filter button in the top ribbon.

If you add filter conditions in both Product Quickfilter and Add Filter sections, they work as AND, meaning that Data View only displays products that meet all the set filters.
Also, you can save your selected filters as segments. See Save filters as segments.
Add a filter in an attribute column
Go to Data View from your site's main menu.
Select the relevant stage or export from the drop-down menu in the top ribbon.
Select Filter in the needed attribute column.
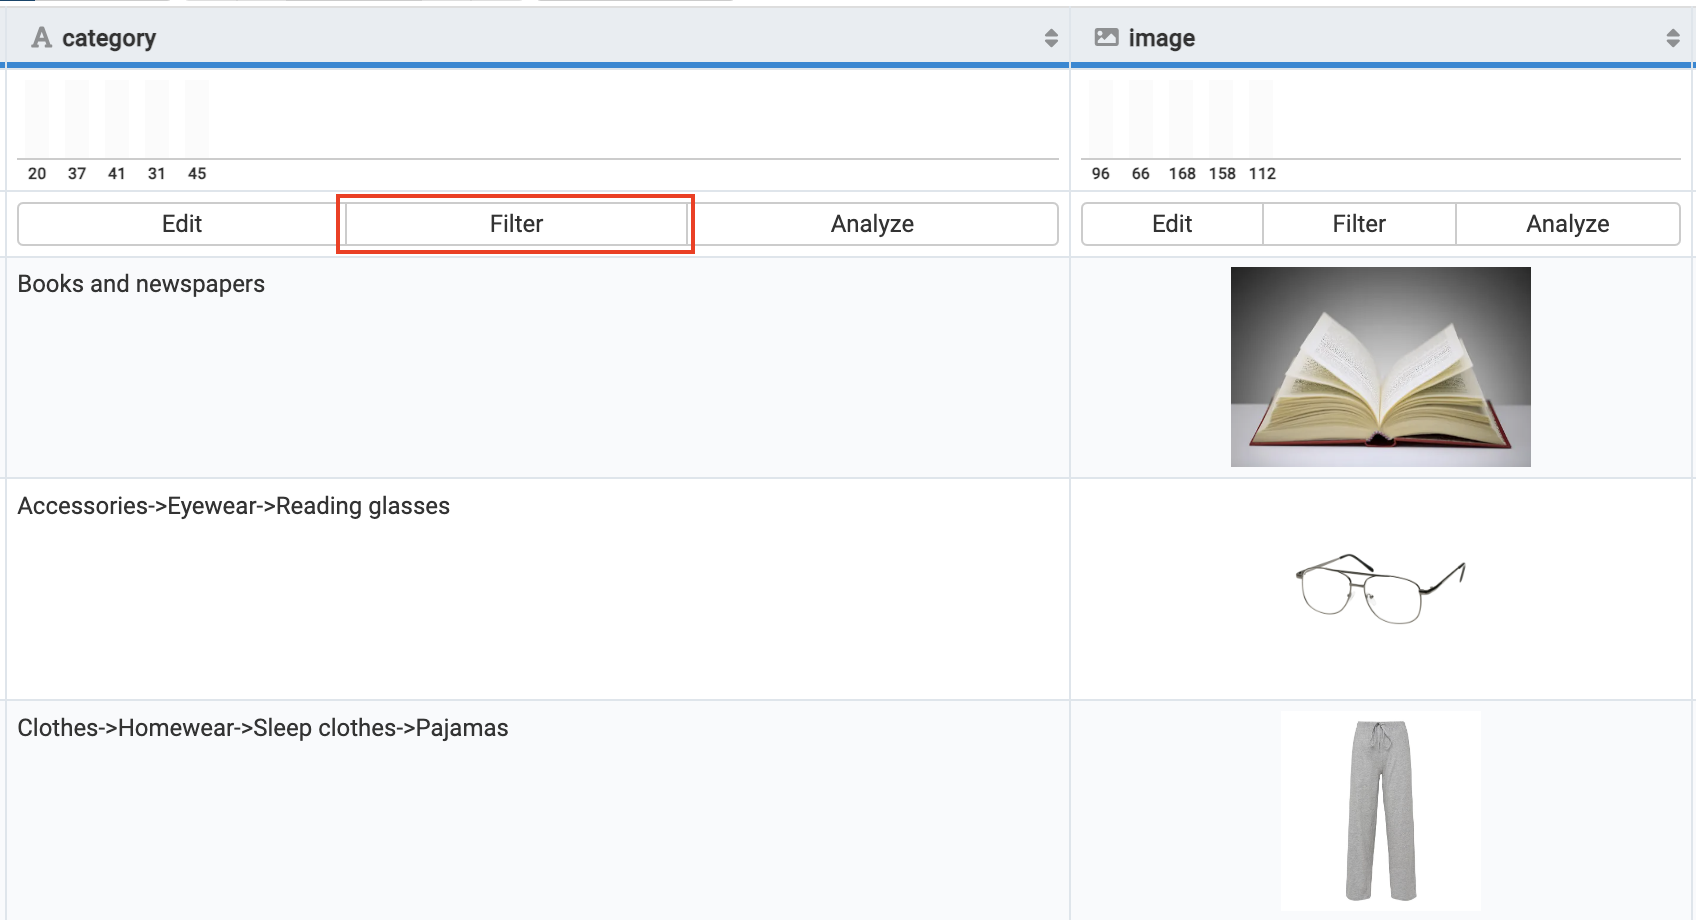
In the Add Filter side panel on the right, check your selected attribute in the first drop-down menu.
Choose the desired filter option in the second drop-down menu.

Note
The passes test and fails test options are only available at the export stage and only for the active exports. These options let you filter out the values that pass or fail the analyzer test in the selected attribute. Then, in the drop-down menu below, you must choose the analyzer test for that attribute.
In Search term, enter a value or select the menu icon to choose the attribute's value.
If needed, add another value by selecting + Add one more and entering the desired value in the field Or. You can remove the additional value by selecting the delete icon
 .
.Select Add.
It takes some time for Data View to refresh and show only the filtered products.
You can see a summary of your applied filter in the section Current Filter.
To restore the original Data View displaying all products, remove the applied filter by selecting the delete icon
 in Current Filter.
If you add filter conditions in both Product Quickfilter and Add Filter sections, they work as AND, meaning that Data View only displays products that meet all the set filters.
Save filters as segments
You can save your filters as a segment and use them instead of creating the filters again from scratch.
Enter the segment name in the Save as Segment field and select Save.
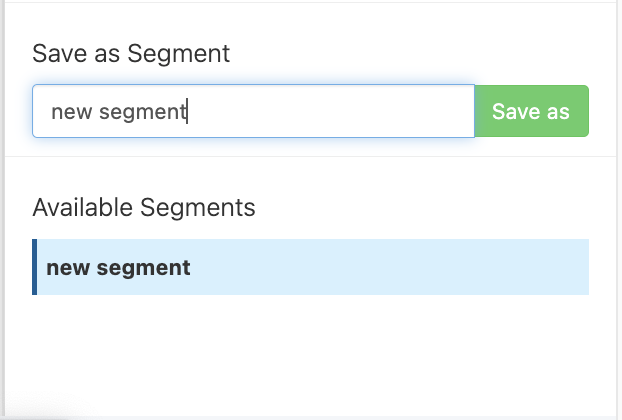
If you create multiple segments and select more than one segment in Available Segments, these filters work as OR, meaning that Data View displays products that meet any filter in the chosen segments. The same logic persists when you apply a rule box to multiple segments.
See Use segments to apply rule boxes to specific product groups to create, edit, and delete a segment.
Preview and edit images using Image Designer
You can preview and edit your product images in Image Designer directly from Data View.
Go to Data View from the site's main menu.
Go to the right-hand side toolbar and select the Image Designer icon to open the Image Designers toolbar.
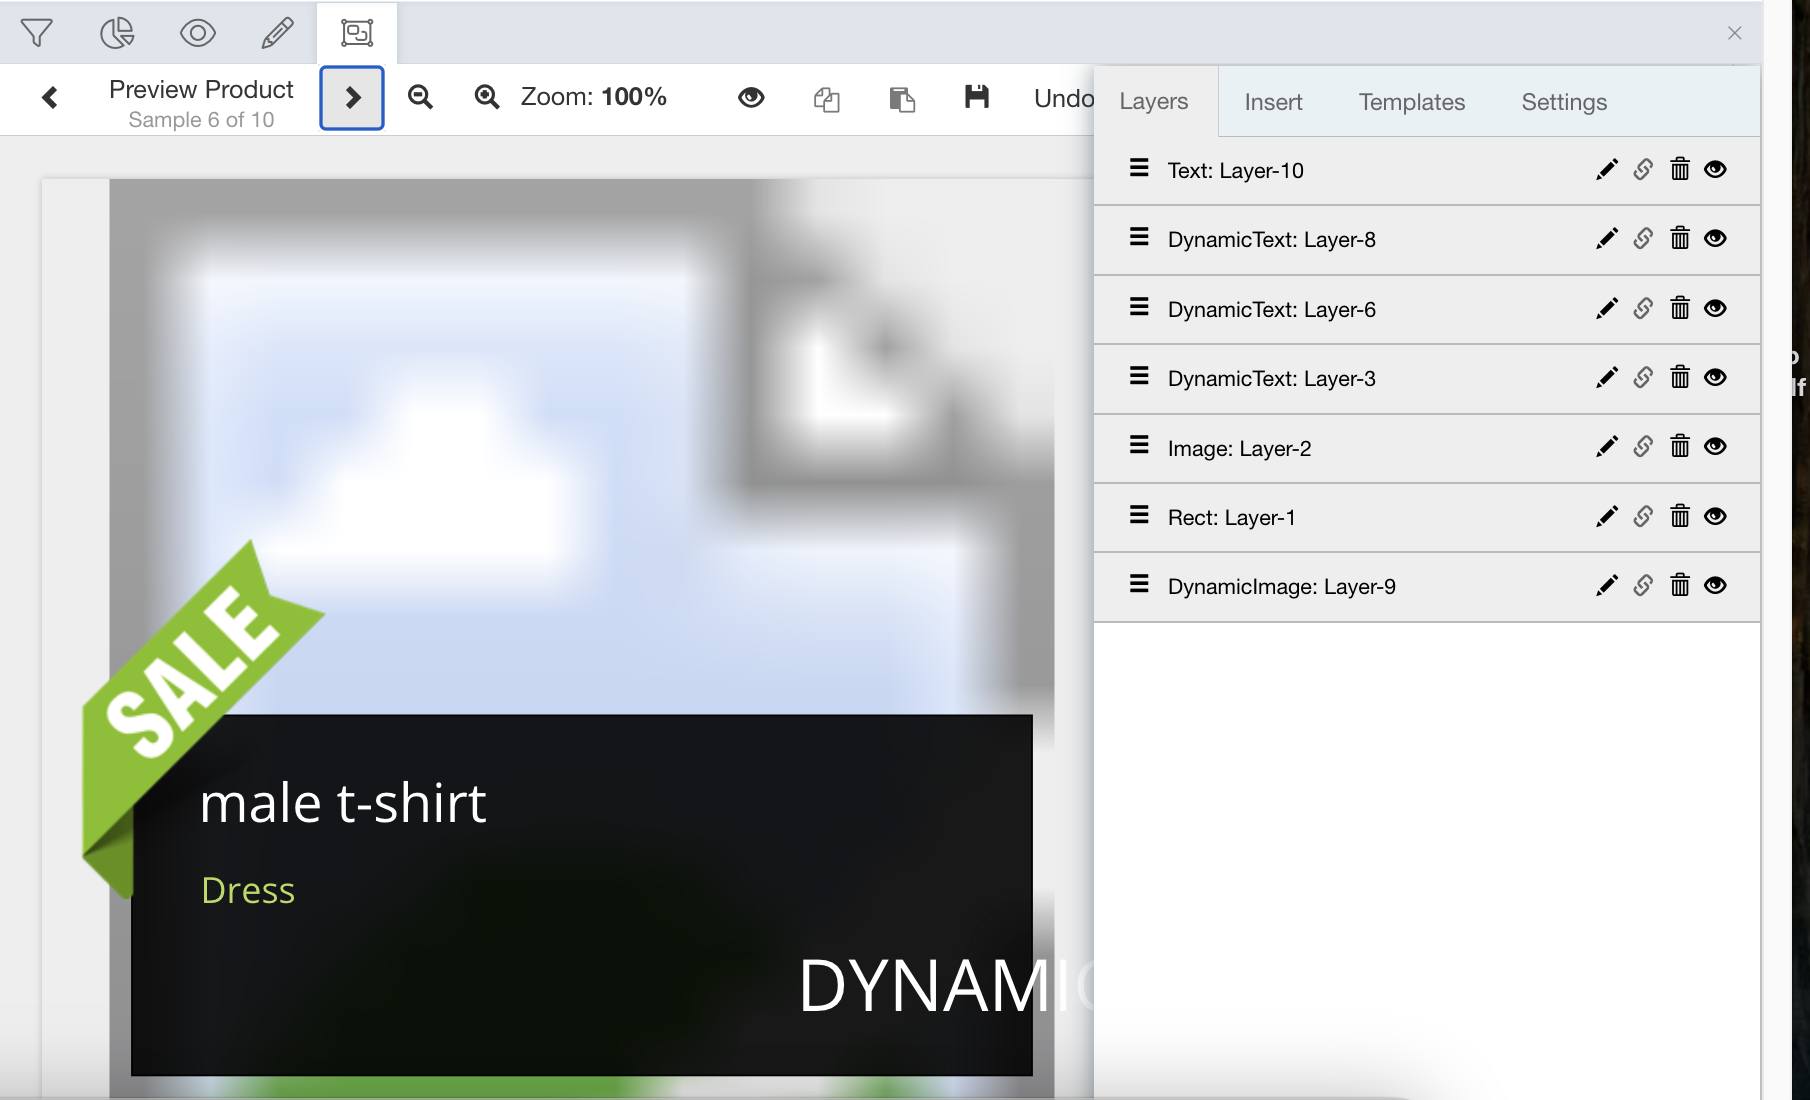
See Create and apply custom image templates for more information about Image Designer and creating dynamic product image campaigns.
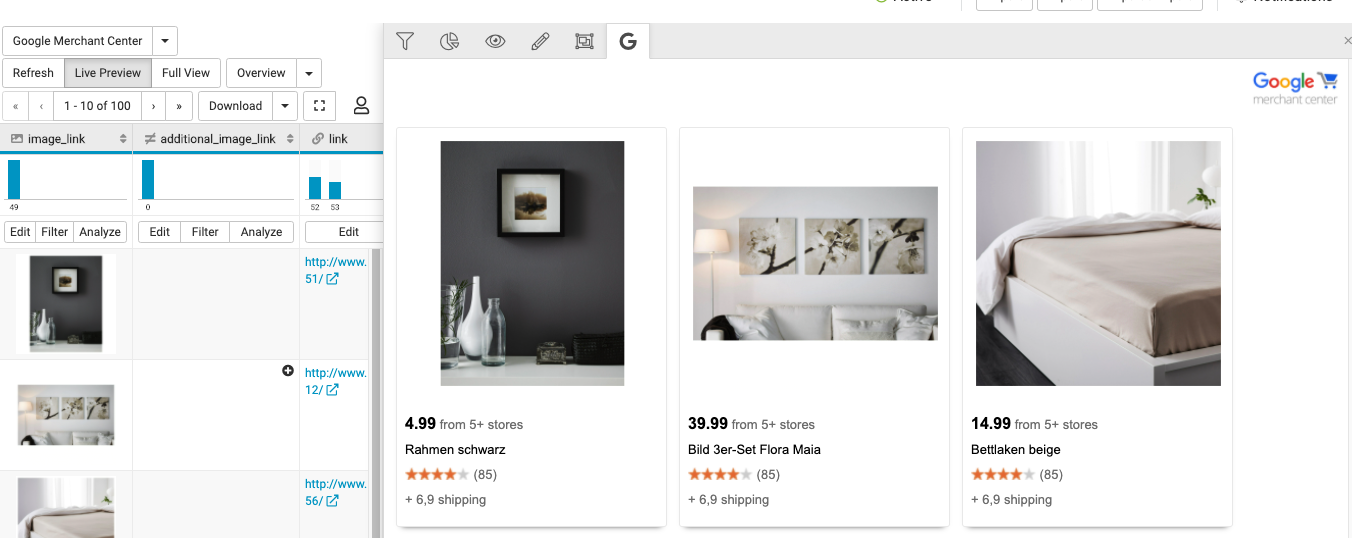
Preview your Google Merchant Center or Amazon Marketplace data
To see how your products look on Google Merchant Center or Amazon Marketplace:
Go to Data View from the site's main menu.
Select your Google Merchant Center or Amazon Marketplace export in the Export selection drop-down menu.
Go to the right-hand side toolbar and select the Amazon or Google icon.
