Usage data dashboard and overage calculations
Get an overview of your platform usage to better understand your billing processes and learn how the Productsup platform calculates overages.
According to the Productsup License Agreement, you get access to the platform based on your contract entitlement. If you exceed your entitlement and overuse the platform, you face additional charges for overages. The platform automatically calculates overages based on particular metrics.
This document explains the formulas used to calculate excessive use of the Productsup platform.
The Usage data dashboard overviews your platform usage and helps you understand charges and overages. The Usage data dashboard shows the essential metrics affecting invoices, such as items, exports, sites, users, and syndication frequency overages.
The dashboard is available in the Billing section of the platform, and only organization admins can access it.
You can also download the detailed usage reports in CSV format.
To access the Usage data dashboard:
Select your admin profile icon in the top-right corner and choose Billing.
Select the Usage tab.
Tip
You can find metrics' meanings under the info icon
 next to each metric name.
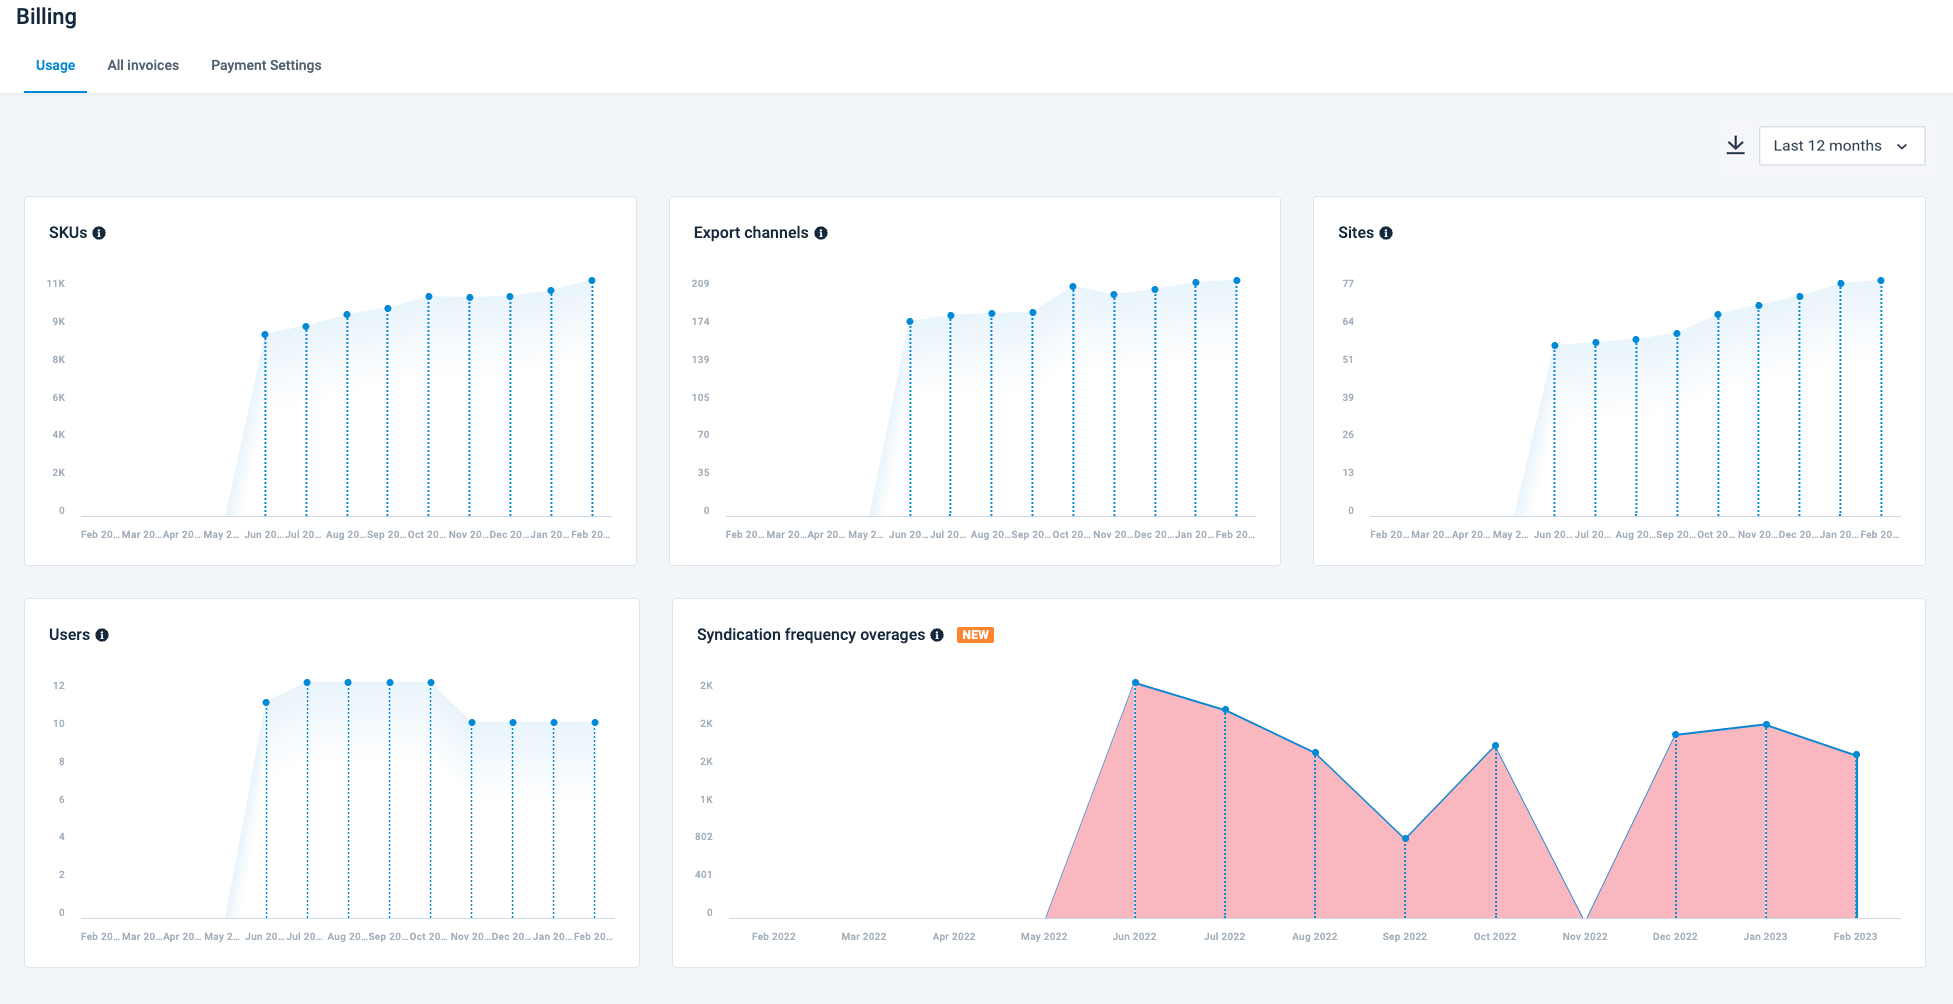
Overage calculation metrics
The platform calculates overages for the following metrics:
Note
Overage calculations exclude the sandbox project usage. See Use your sandbox project for testing purposes.
Max items
The platform identifies the maximum items imported or exported daily for each non-manual site run for every organization or edition and calculates the monthly overage. Non-manual runs are the ones that use the site scheduling, a trigger of another site, or an API triggers the site.
The formula for overage calculation is:
Overage = [the highest number of items per day within a month] - [your service entitlement]
For example, if the item entitlement is 5000, the overage calculation looks as follows:

The overage for January 2021 is 5000, calculated as 10000 actual items - 5000 items from the entitlement. There are no overages in February 2021, as the platform imported or exported exactly 5000 items.
Exports
The platform takes daily snapshots of the number of your configured main and standard exports for every organization or edition and calculates the monthly overage.
The overage calculations for the exports metric takes into account export clustering. See Export clustering to learn how it works.
The formula for overage calculation is:
Overage = [the total number of clustered exports within a month] - [your service entitlement]
Note
The platform doesn’t count the sandbox project’s exports. See Use your sandbox project for testing purposes.
For example, if the exports entitlement is 60, the overage calculation looks as follows:
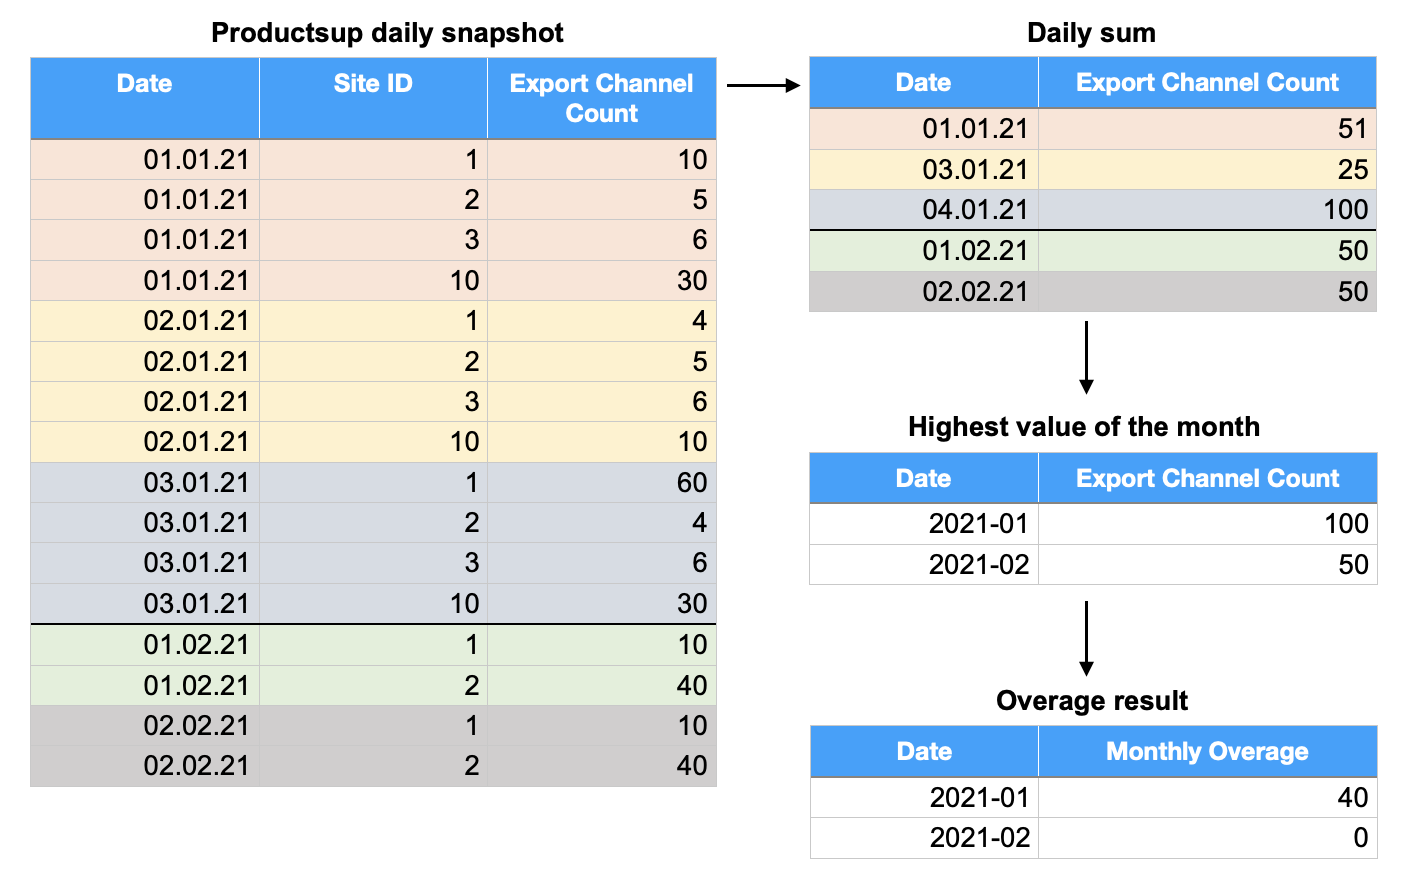
The overage for January 2021 is 40, calculated as 100 added exports - 60 exports from the entitlement. There are no overages in February 2021, as the customer added only 50 exports.
Export clustering
The Productsup platform uses export clustering to calculate overages for exports. Productsup has three (3) types of exports:
Standard export: highlighted in green in the following example tables.
Main export: highlighted in yellow in the following example tables.
Sub-export: highlighted in red in the following example tables.
Standard exports
A standard export is the default export that doesn't have any classifications or sub-exports. For example, Google Merchant Center.
To count standard exports on the site level, use the following formula:
[The same standard export added N times] = N
For example:

The platform counts the standard export A every time you add it, which makes up three (3) exports.
Main exports
The main export is a standard export that can have one or more sub-exports associated with it. For example, Upljft - Basic catalog is the main export for sub-exports Upljft - Country feed and Upljft - Language feed. This system helps to avoid overages by clustering multiple similar sub-exports that send data to the same channel but for different countries, languages, etc.
To count main exports on the site level, use the following formulas:
[The same main export added N times] = 1For example:

The platform counts the standard export A every time you add it, which makes up two (2) exports, while it counts the main export B as one (1) export although added twice. In total: three (3) exports.
[N different main exports added] = NFor example:

The platform counts the standard export A every time you add it, which makes up two (2) exports, while it counts the main export B as one (1) export although added twice. The platform counts main export C added once as one (1) export. In total: four (4) exports.
Sub-exports
A sub-export is an export that belongs to the main export and helps cluster multiple similar exports that send data to the same channel but for different countries, languages, etc. However, there might be cases where a sub-export doesn’t belong to the main export because there is no need of the main export for certain setups. In this case, the platform creates a non-global placeholder as the main export and associates sub-exports with it. For example, FabDis exports, such as Fabdis 3.0 - C01_Extension, are sub-exports that belong to the non-global placeholder main export FabDis 3.0 - Master Channel Shell.
To count sub-exports on the site level, use the following formulas:
[The same sub-export added N times] = 1For example:

The platform counts the standard export A and the main export B as two (2) exports, while it counts the sub-export C belonging to the main export D as one (1) export although it is added twice. In total: three (3) exports.
[N different sub-exports belonging to the same main export] = 1For example:

The platform counts the standard export A and main export B as two (2) exports, and it counts all sub-exports belonging to the same main export D as one (1) export, although they are added three times (twice for C and once for F). In total: three (3) exports.
[Sub-exports from N different main exports] = NFor example:
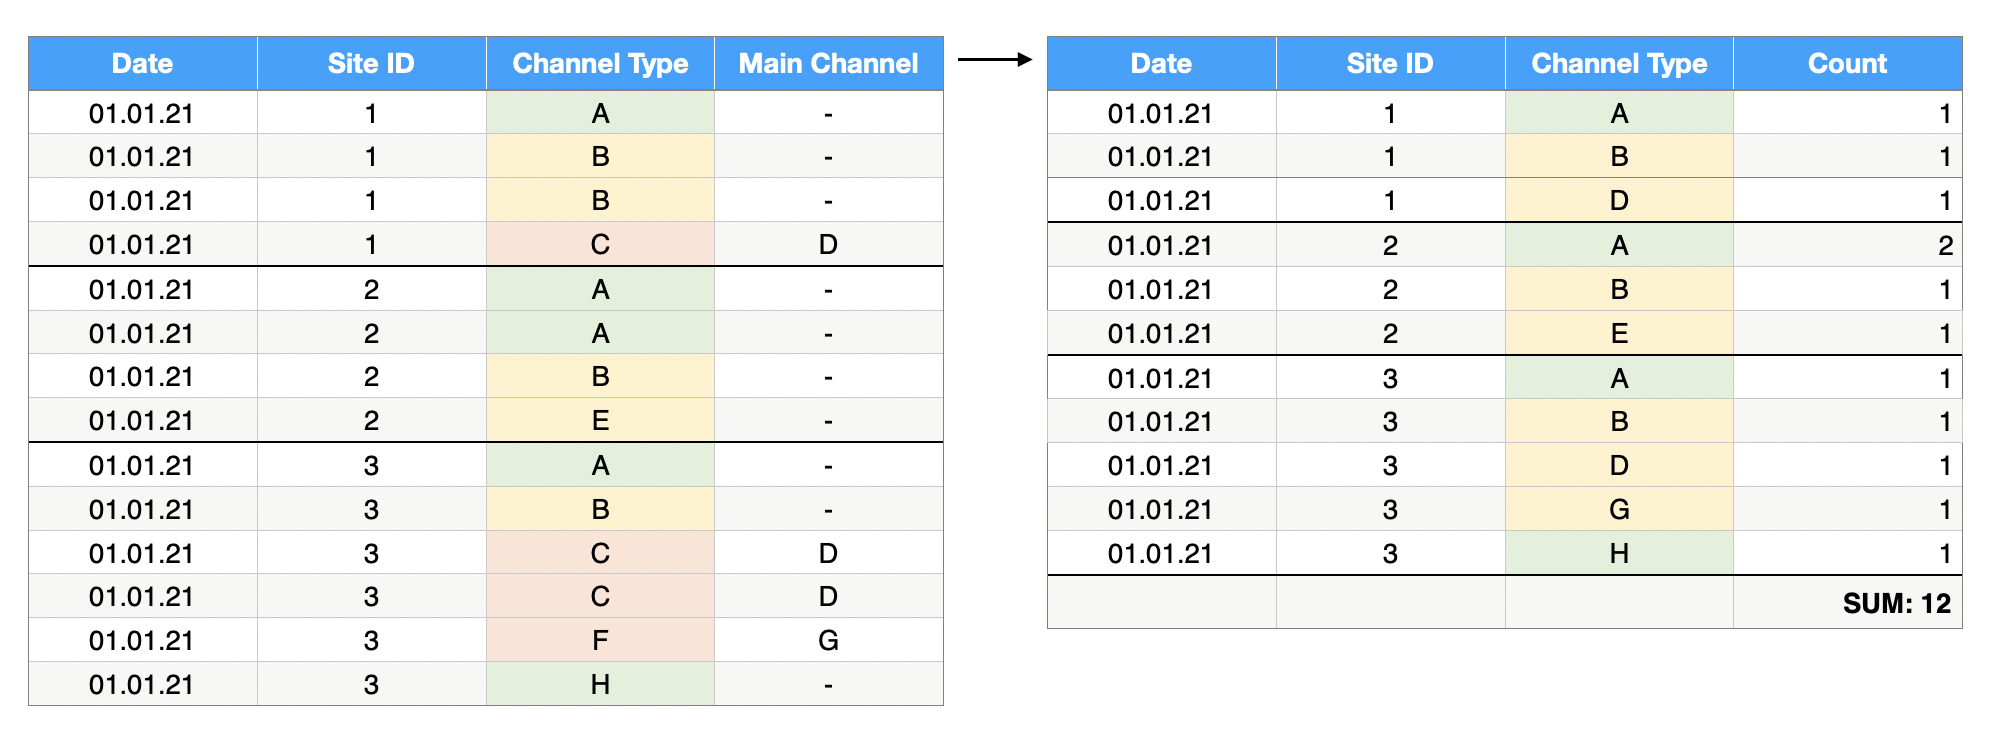
The platform makes the following calculations:
Counts every time you add each standard export A and H per site, which makes five (5) exports.
Counts the main exports B and E only once for each export type per site, regardless of how many times you added them. This makes four (4) exports.
Counts two (2) sub-exports C belonging to the main export D, and one (1) sub-export F belonging to the main export G, only once for each main export per site. This makes three (3) exports.
In total: 12 exports.
Users
The platform makes a daily snapshot of the number of users in each organization or edition and calculates the monthly overage.
The formula for overage calculation is:
Overage = [the highest number of users daily within a month] - [your service entitlement]
For example, if the users entitlement is 10, the overage calculation looks as follows:
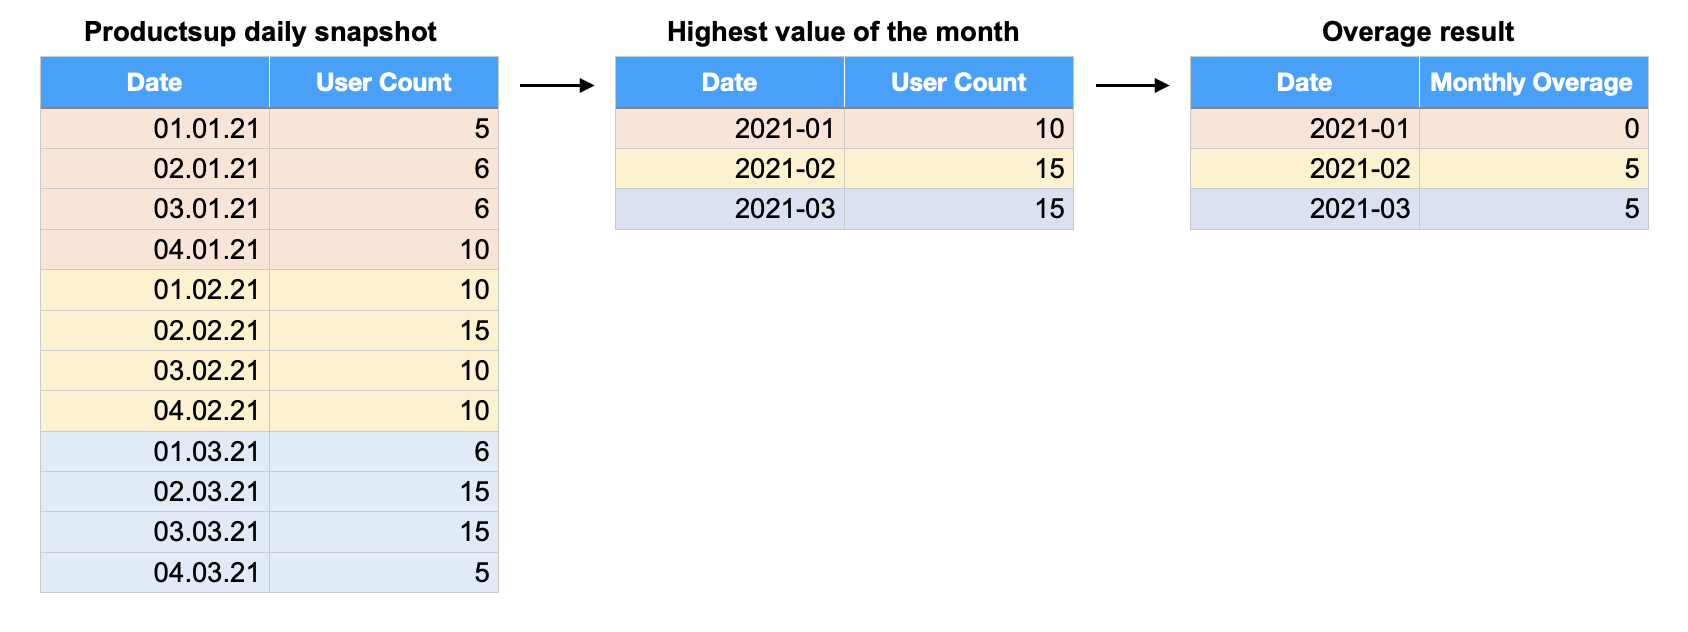
The overage for January 2021 is 10-10=0. For February and March 2021, it is 15-10=5.
Sites
The platform makes a daily snapshot of the number of sites or catalogs in every Seller/Vendor Onboarding Module in each organization and calculates monthly overage.
The formula for overage calculation is:
Overage = [the highest number of sites within a month] - [your service entitlement]
For example, if the sites entitlement is 10, the overage calculation looks as follows:
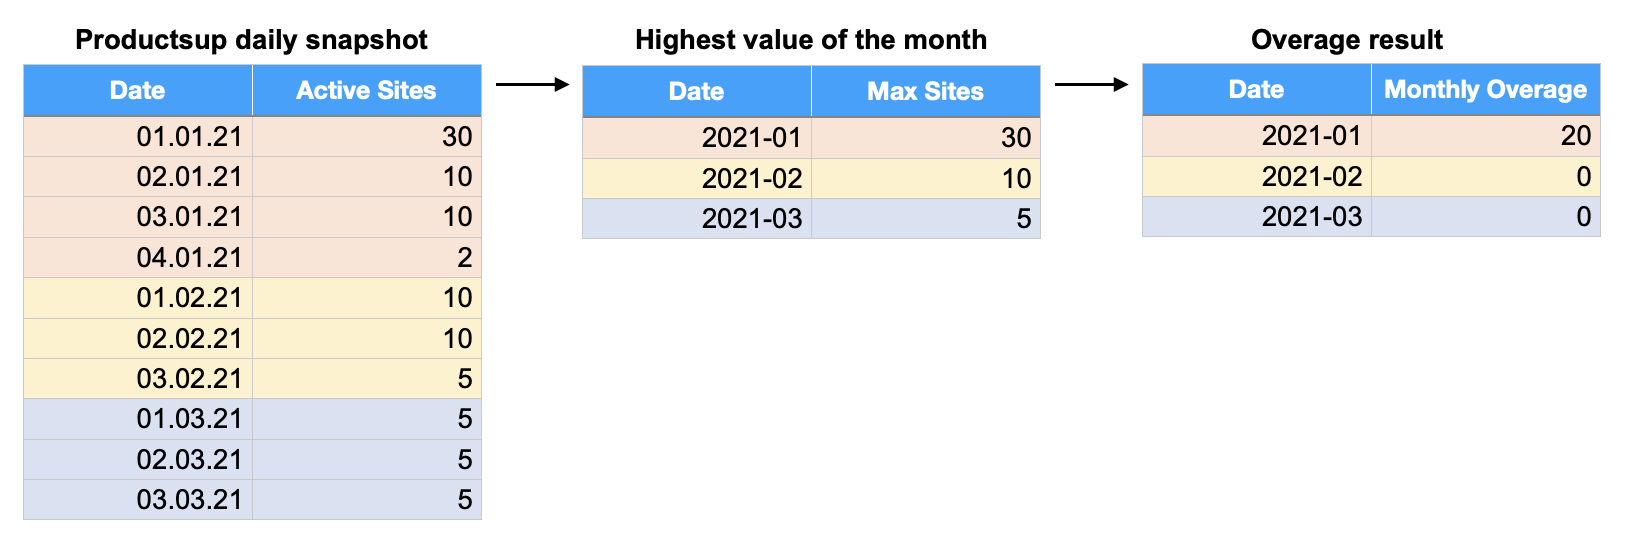
The overage for January 2021 is 30-10=20. For February and March 2021, it is 10-10=0 and 5-10=-5, and both result in zero (0) overages.
Syndication frequency overages
The platform makes a daily snapshot of the number of syndications per export in each organization and calculates the monthly overage. Syndication is the sum of exports runs per site per day.
Warning
The platform doesn't count manual site runs triggered when you select the Export or Run buttons. However, if the manual site run triggers another site run, the triggered site run counts as syndication and increases the total syndication frequency count by one (1). To prevent overages in this case, check the triggering settings of your sites in Scheduling. See Set up scheduling and triggering processes in Scheduling for more information.
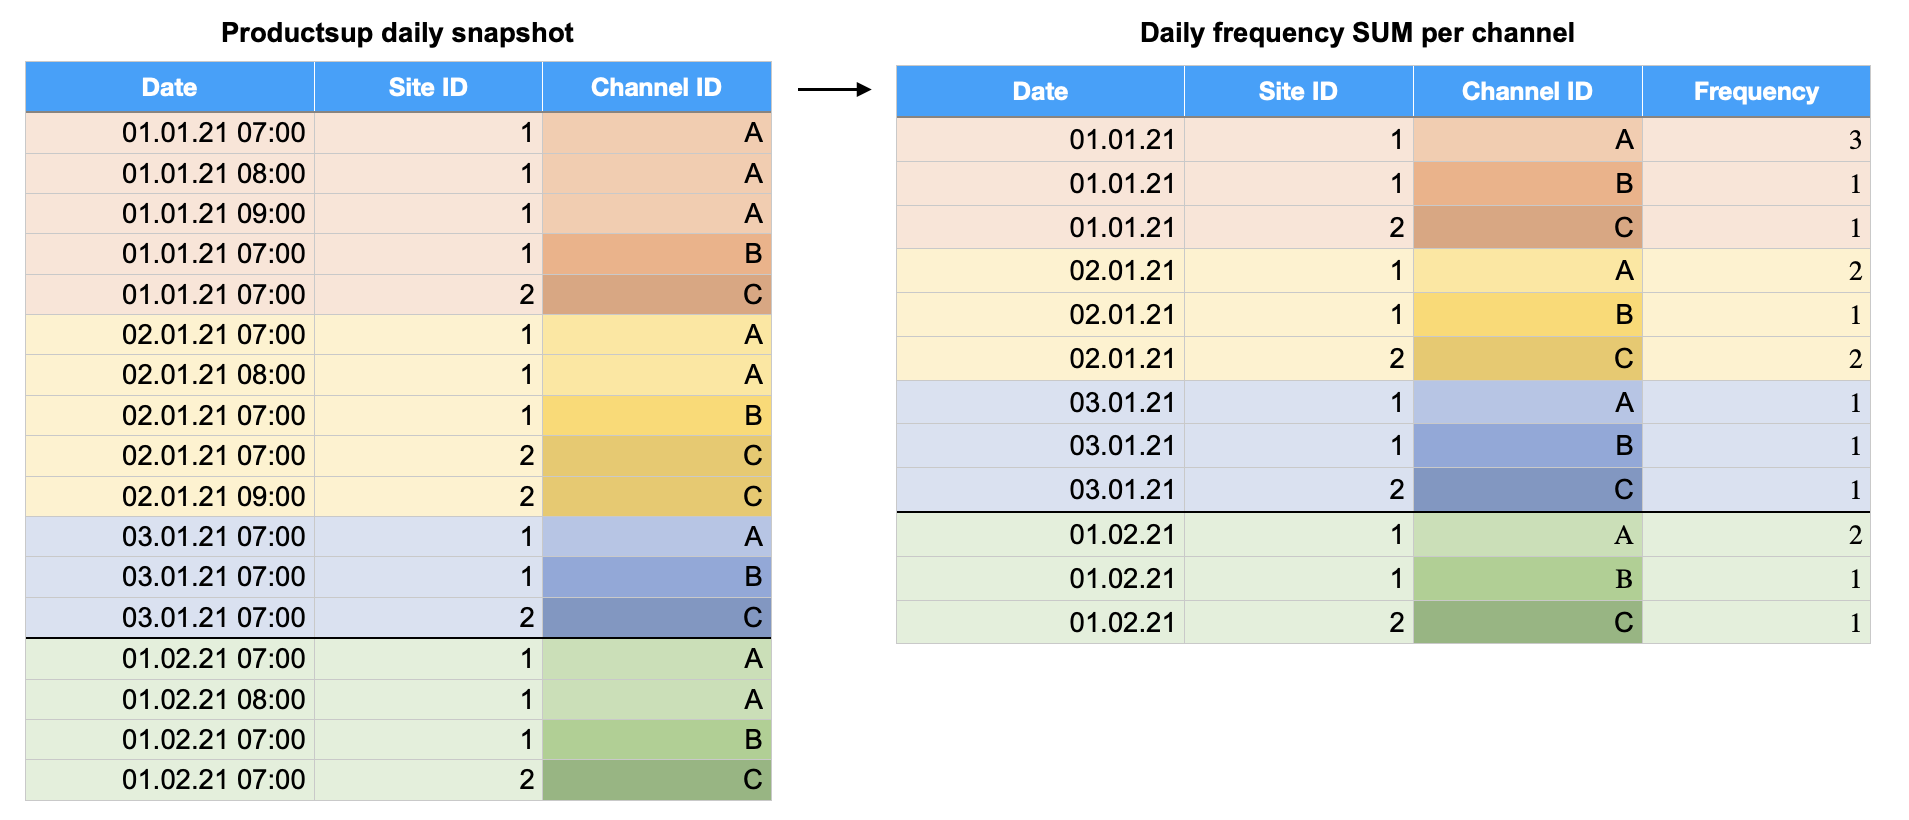
Suppose the organization has three (3) active exports: A and B in site 1, and C in site 2. The syndication frequency entitlement per export is 1.
The following syndication frequency happened during January 2021:
01.01.2021: Three (3) syndications for export A, one (1) for export B, and one (1) for export C.
02.01.2021: Two (2) syndications for export A, one (1) for export B, and two (2) for export C.
03.01.2021: One (1) syndications for each export.
 |
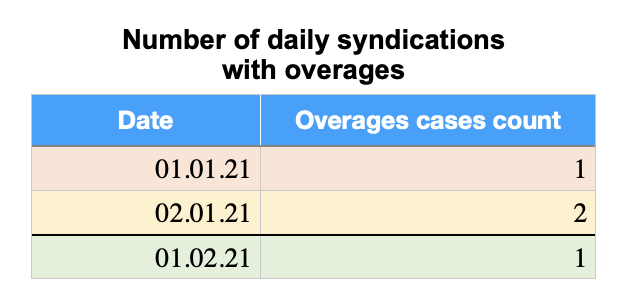
The platform doesn’t count the number of syndications but only the fact of exceeding the entitlement per export per day, and sums up these daily cases for a month.
In this example, the number of daily syndications with overages on 01.01.2021 is only one (1) because only export A exceeds the entitlement. On 02.01.2021, it is two (2) as two (2) exports exceed the entitlement. And on 03.01.2021, there were no overages. See the following table:
 |
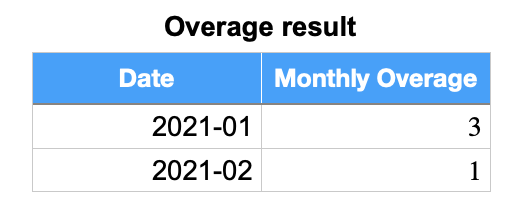
January overages equal the sum of one (1) exceeding syndication case on 01.01.2021 and two (2) cases on 02.01.2021, which makes three (3) in total for January. See the following table:
 |
Syndication frequency overages details
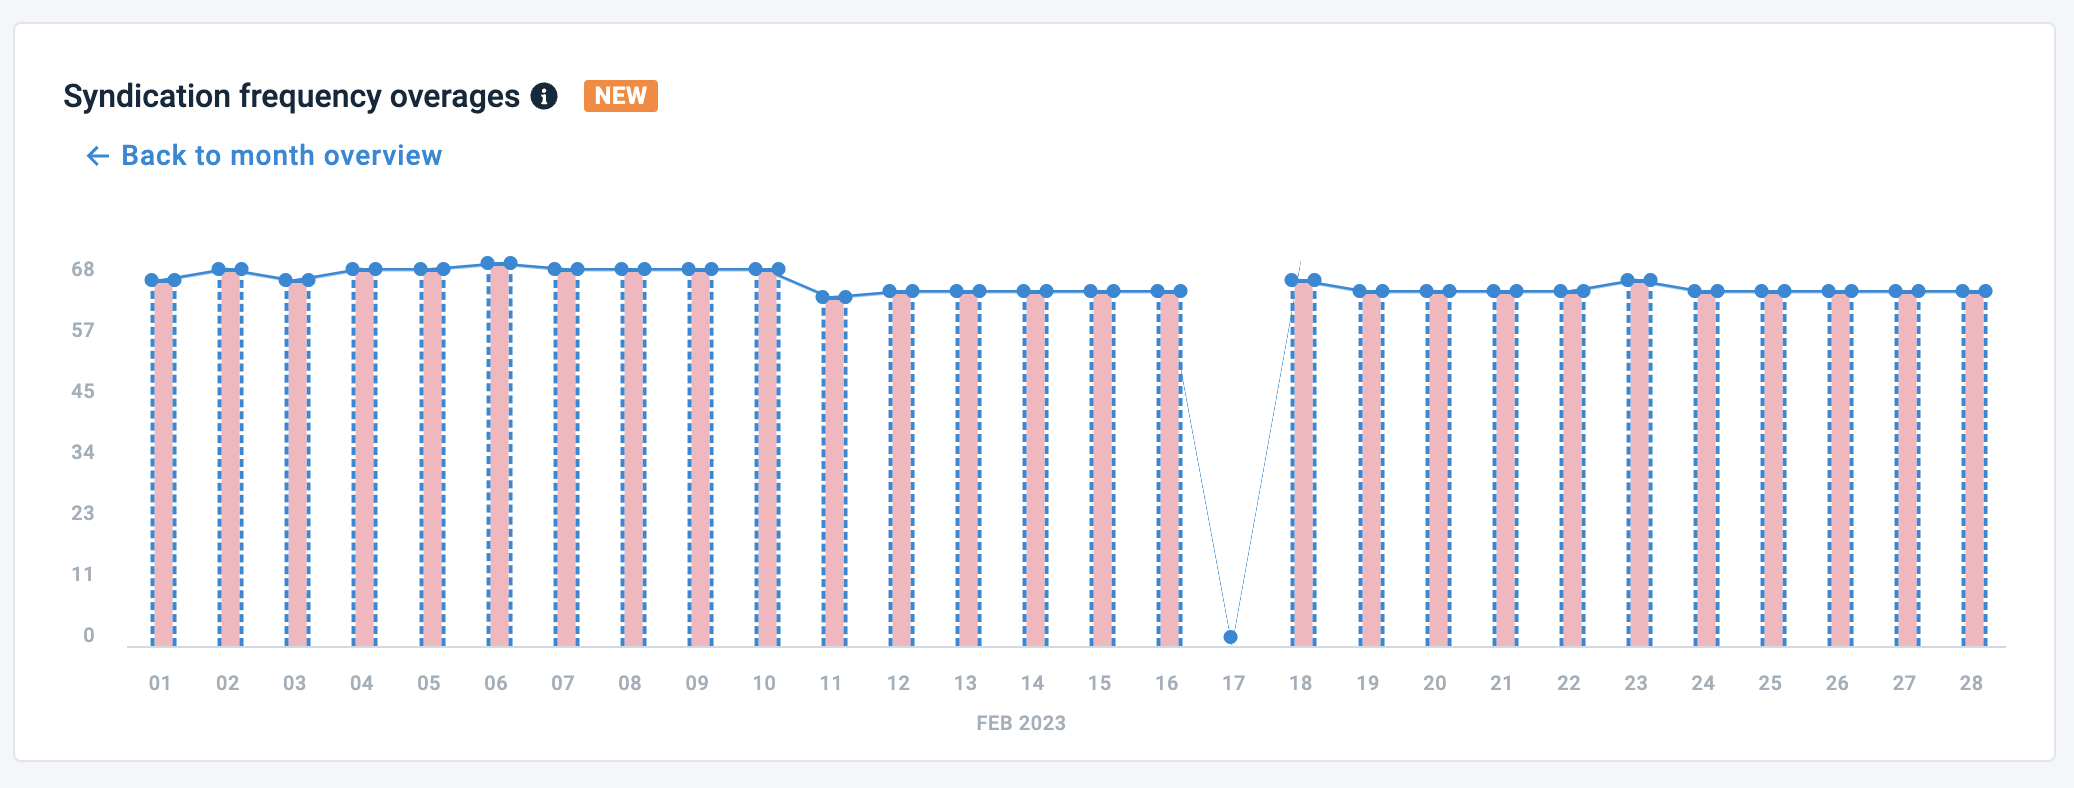
You can view details of syndication frequency overages per day:
Select a necessary month bar on the Syndication frequency overages graph.

Select a necessary day bar on the Syndication frequency overages graph.
The Syndication Frequency Overages Details table shows all sites that lead to overages. You can check the following metrics for each site in your organization for a selected day:
Overage
Exports
Entitlement
Syndications
 |
You can take the following actions:
Select another day.
Open the day picker dropdown. The red dots in the top-right corner of a day indicate the days with overages.
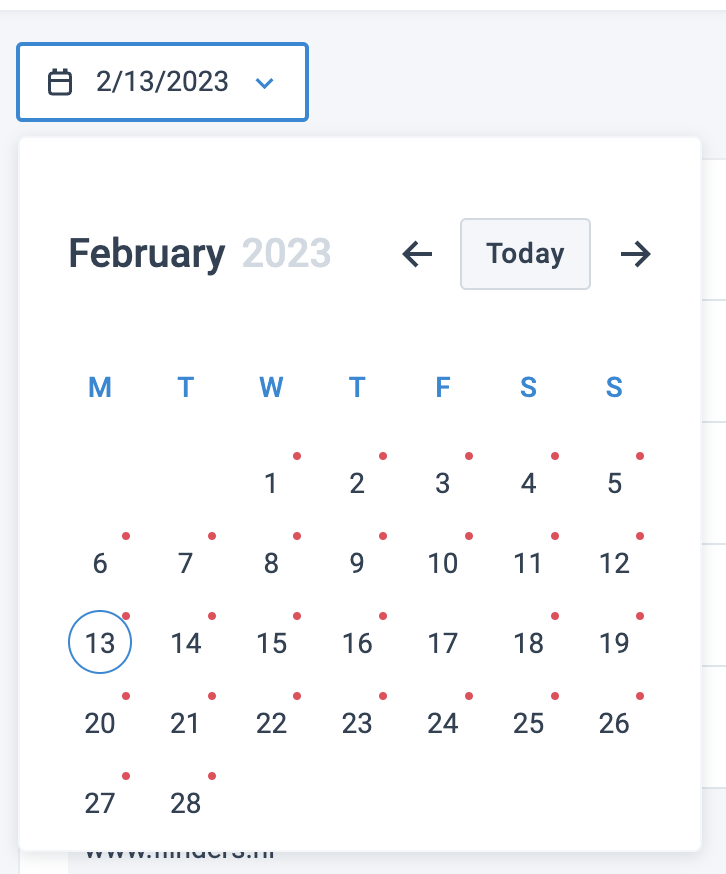
Select a necessary day.
View the list of exports for each site and deactivate unnecessary exports to reduce overages:
Select a number next to the necessary site in the Exports column to go to the Overview tab of the Exports page of the site.
Check the active exports and deactivate unimportant exports.
View the scheduling of each site:
Hover over a necessary site line and select View Scheduling to get to the Site Scheduling tab in Scheduling.
Adjust your schedule to match your entitlement. See Schedule your site runs in Site Scheduling.
Download the usage reports
You can download the detailed usage reports in CSV format. The reports contain information for one (1) selected month with daily data. You get a .zip folder named usage-report-YYYY-MM that consists of the following CSV files:
Excluded sites with names
Exports with names
Max items with names
Sites with names
Syndication frequency with names
Users with names
Note
You can download the reports only for the months starting from November 2022.
To download the reports, do the following:
Go to the Usage tab.
Select the download icon
 .
.
Select the year and month for the report.
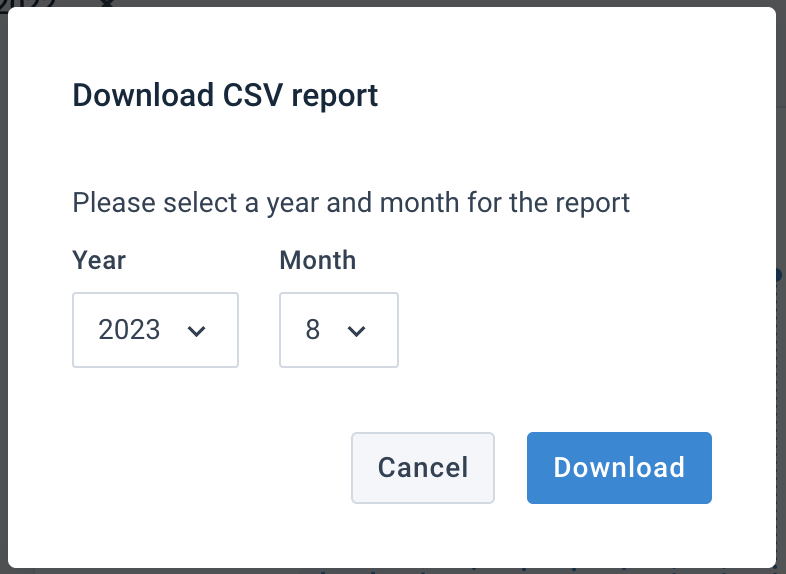
Select Download.
Format the downloaded usage report
If the CSV files show all data in a single cell instead of separate rows and columns, you may need to set a delimiter in the Table settings of your tool:
For Numbers on macOS, do as follows:
Select the Table button.
Select the Adjust Import Settings… button.
Select a comma (,) in Separate Value Using.
Select Update Table.
For Microsoft Excel, do as follows:
Go to the Data tab.
In Get & Transform Data, select From Text/CSV.
In Import Data, find and select your CSV file.
In Text Import Wizard, select Delimited and select Next.
Choose a comma (,) or a semicolon (;) as a delimiter and select Next.
Check if the preview shows all the necessary columns highlighted and select Next.
Choose the appropriate data format for each column, such as General, Text, or Date, and select Finish.
The Productsup Help Center disclaims all responsibility and accountability for the accuracy and relevance of the processes, features, UI elements, and other information mentioned in these instructions about third-party tools. The instructions aim to help you perform activities outside the Productsup platform.