Group data across multiple rows with the Group Attributes data service
Group Attributes data service: Group data across multiple products with the Group Attributes data service in Productsup.
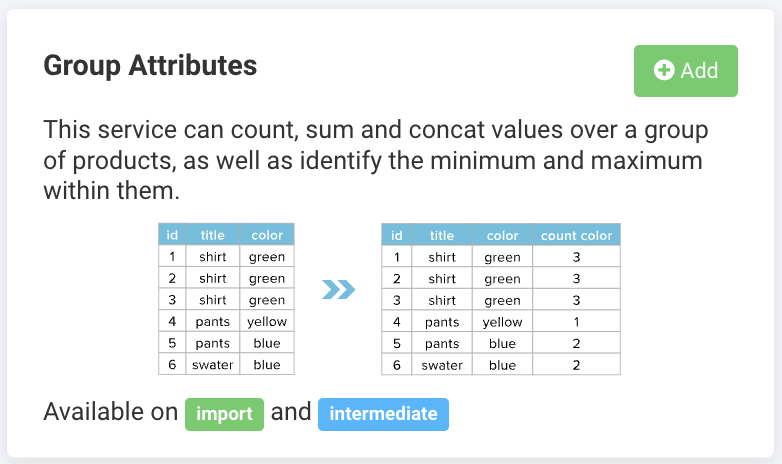
The Group Attributes data service lets you create a new attribute in your site to group values from a chosen attribute for all products that have the same value in a grouping attribute. For example, for all products in your site that have the same value in the grouping attribute id, you can create a new attribute ___grouped and populate it in the following ways:
Add all values of a chosen attribute. See Concat method.
Count values of a chosen attribute and output the result. See Count method.
Identify and save the highest or lowest value in a chosen attribute. See Max and Min methods.
Produce a sum of all values of a chosen attribute. See Sum method.
The service works based on the SQL function GROUP BY. See SQL Tutorial for more information.
Note
The Group Attributes data service is available for the import and intermediate stages.
Prerequisites
To set up the Group Attributes data service, you need:
A unique item identifier. See Set a unique item identifier for more information.
Add the Group Attributes data service
Go to Data Services from your site's main menu and select Add Service.
Search for Group Attributes, select Add, and rename the data service as desired.

Choose the stage containing the attributes you want to group in Service Data Level and select Add. This takes you to the data service setup:

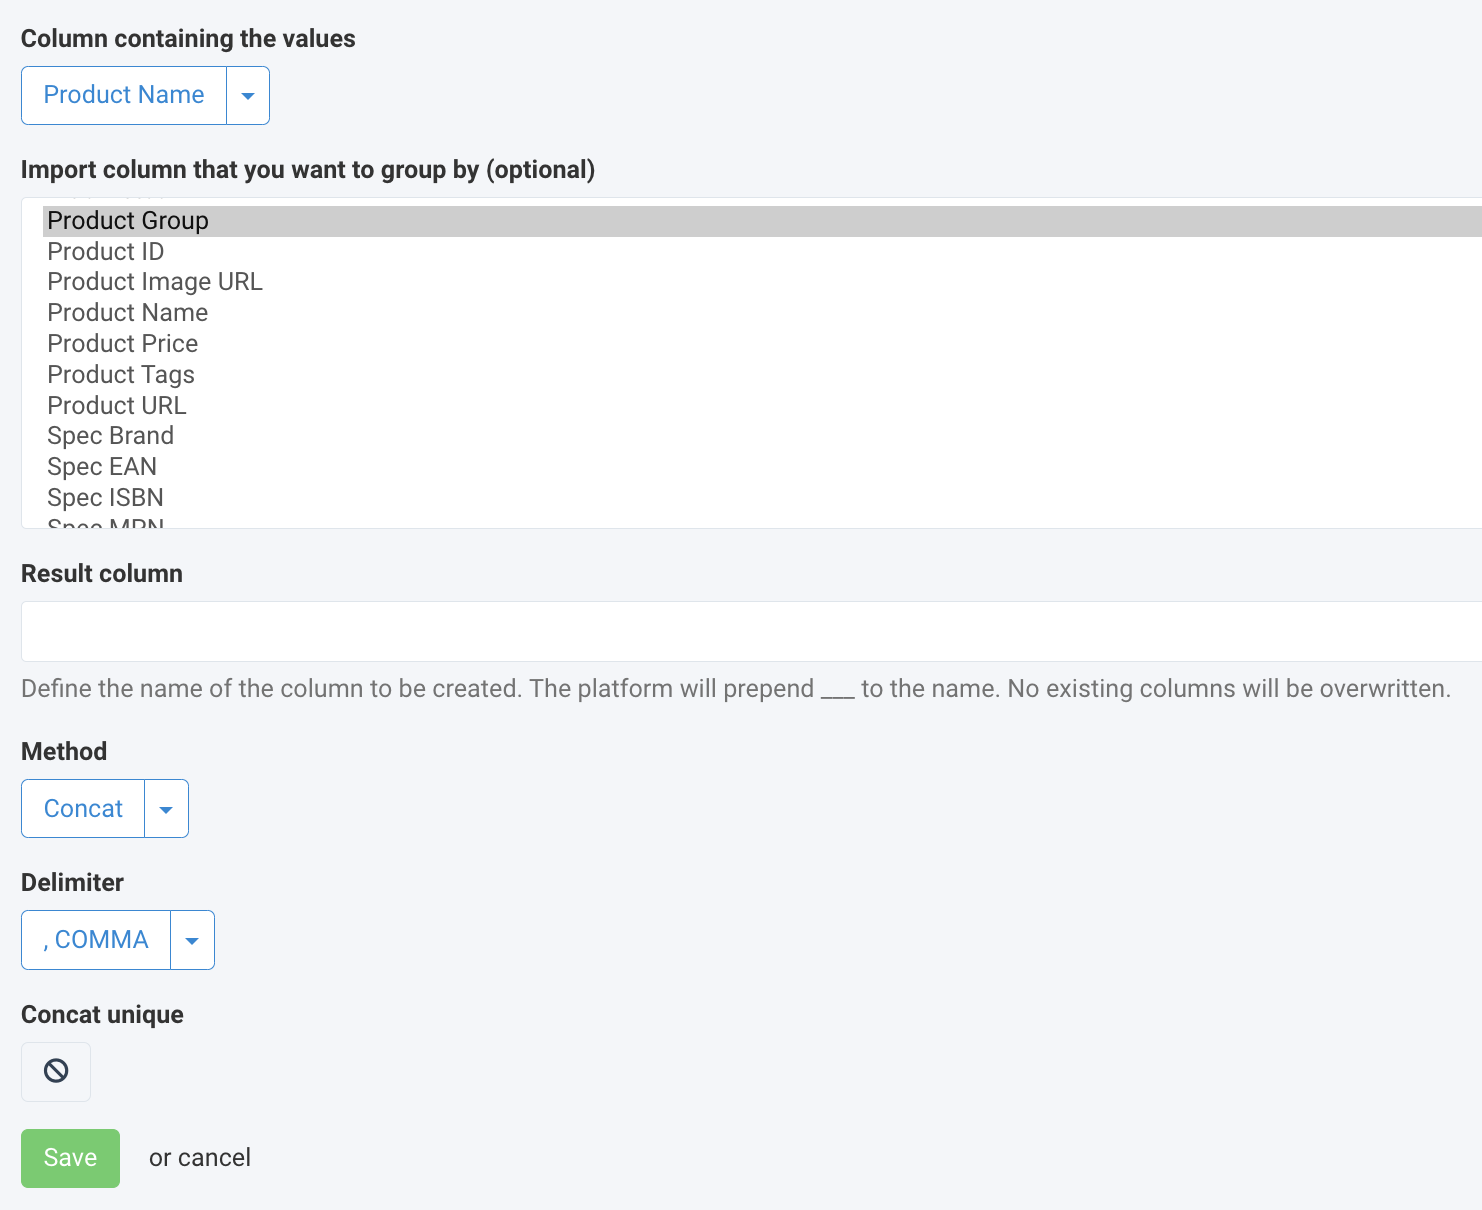
Select the attribute containing the values you wish to group from the drop-down menu Attribute containing the values.
Note
If you choose Import in Service Data Level in Step 3, the drop-down menu Attribute containing the values displays the attributes of your import stage. If you choose Intermediate, the drop-down menu shows your intermediate-stage attributes.
In the drop-down menu Import attribute you want to group by, select the import-stage attribute which should determine your value-grouping range. If multiple products have the same value in this grouping attribute, the data service analyzes the values of these products in the attribute chosen in Step 4 and groups the values of these products in a newly-created attribute named in Step 6 by performing the action chosen in Step 7
To choose several grouping attributes, hold the CTRL (or CMD) key while selecting.
In Import attribute you want to group by, you can't choose an attribute that contains only empty values. If you do so and try to save the data service setup, the platform shows an error and prompts you to change your attribute selection:

Enter the desired name of the new attribute in Result attribute.
The system creates a new attribute to store the grouped data without overwriting your existing attributes. The platform prepends the attribute name specified in this field with the prefix you set in Step 2.
Select the grouping method from the Method drop-down menu.
Note
For the Concat method only:
In Delimeter, select the delimiter that separates the grouped values in the new attribute.
Activate Concat unique if you don't want to display duplicate values.
Select Save.
For the platform to process a new data service, select Run in the top-right corner of your site's view.
Output examples of different grouping methods
While setting up the data service, you can select from five different data-grouping methods in the Method drop-down menu:
Concat
Count
Max
Min
Sum
Here is a sample feed we can use to show how each grouping method works:
id | item_group_id | stock | size | color | discount_in_percent |
|---|---|---|---|---|---|
1 | 123 | 4 | S | red | 10 |
2 | 123 | 2 | S | blue | 15 |
3 | 123 | 1 | L | blue | 25 |
4 | 456 | 5 | 38 | black | 7 |
5 | 456 | 4 | 38 | blue | 15 |
6 | 456 | 7 | 38 | green | 5 |
7 | 456 | 2 | 40 | green | 10 |
Concat method
Use the Concat method to combine all values from different products in one attribute.
Example:
To concat sizes for products with the same item_group_id, use the following setup:
Attribute containing the values:
sizeImport attribute you want to group by:
item_group_idResult attribute:
concat_sizesMethod: Concat
Delimiter: ,COMMA
Concat unique: off
Using this setup, the system groups all sizes of the products with the same item_group_id in a newly created ___concat_sizes attribute:
id | item_group_id | stock | size | color | discount_in_percent | ___concat_sizes |
|---|---|---|---|---|---|---|
1 | 123 | 4 | S | red | 10 | S,S,L |
2 | 123 | 2 | S | blue | 15 | S,S,L |
3 | 123 | 1 | L | blue | 25 | S,S,L |
4 | 456 | 5 | 38 | black | 7 | 38,38,38,40 |
5 | 456 | 4 | 38 | blue | 15 | 38,38,38,40 |
6 | 456 | 7 | 38 | green | 5 | 38,38,38,40 |
7 | 456 | 2 | 40 | green | 10 | 38,38,38,40 |
Note
The system combines the data without any spaces between characters.
Count method
Use the Count method to count the number of product variations.
Example:
To count the number of product variations with the same item_group_id, use the following setup:
Attribute containing the values:
item_group_idImport attribute you want to group by:
item_group_idResult attribute:
count_variationsMethod: Count
Using this setup, the system counts all product variations with the same item_group_id and records the result in a newly created ___count_variations attribute:
id | item_group_id | stock | size | color | discount_in_percent | ___count_variations |
|---|---|---|---|---|---|---|
1 | 123 | 4 | S | red | 10 | 3 |
2 | 123 | 2 | S | blue | 15 | 3 |
3 | 123 | 1 | L | blue | 25 | 3 |
4 | 456 | 5 | 38 | black | 7 | 4 |
5 | 456 | 4 | 38 | blue | 15 | 4 |
6 | 456 | 7 | 38 | green | 5 | 4 |
7 | 456 | 2 | 40 | green | 10 | 4 |
Max and Min methods
Use the Max or Min methods to find and display the highest or lowest value.
Example:
To return the highest discount among all products with the same item_group_id, use the following setup:
Attribute containing the values:
discount_in_percentImport attribute you want to group by:
item_group_idResult attribute:
max_discountMethod: Max
Using this setup, the system compares discounts of all products with the same item_group_id and records the highest value in a newly created ___max_discount attribute:
id | item_group_id | stock | size | color | discount_in_percent | ___max_discount |
|---|---|---|---|---|---|---|
1 | 123 | 4 | S | red | 10 | 25 |
2 | 123 | 2 | S | blue | 15 | 25 |
3 | 123 | 1 | L | blue | 25 | 25 |
4 | 456 | 5 | 38 | black | 7 | 15 |
5 | 456 | 4 | 38 | blue | 15 | 15 |
6 | 456 | 7 | 38 | green | 5 | 15 |
7 | 456 | 2 | 40 | green | 10 | 15 |
Sum method
Use the Sum method to return the numerical sum of products matching the selected conditions.
Example:
To sum the stock for products with the same item_group_id and color, use the following setup:
Attribute containing the values:
stockImport attribute you want to group by:
item_group_idandcolorResult attribute:
stock_sumMethod: Sum
Using this setup, the system sums the values of all products with the same item_group_id and color and records the numbers in a newly created ___stock_sum attribute:
id | item_group_id | stock | size | color | discount_in_percent | ___stock_sum |
|---|---|---|---|---|---|---|
1 | 123 | 4 | S | red | 10 | 4 |
2 | 123 | 2 | S | blue | 15 | 3 |
3 | 123 | 1 | L | blue | 25 | 3 |
4 | 456 | 5 | 38 | black | 7 | 5 |
5 | 456 | 4 | 38 | blue | 15 | 4 |
6 | 456 | 7 | 38 | green | 5 | 9 |
7 | 456 | 2 | 40 | green | 10 | 9 |
Edit the Group Attributes data service
Go to Data Services from your site's main menu.
Change the settings of the needed data service:
To deactivate a data service, choose the pause icon next to the desired data service.
Select the cogwheel icon (⚙) next to the desired data service to edit other settings and select Save.
Delete the Group Attributes data service
Go to Data Services from your site's main menu.
Tip
To stop a data service from affecting your feed without deleting the data service itself, you can choose the pause icon next to the desired data service.
Select the cogwheel icon
 next to the desired data service.
In the Danger Area panel, select Remove this service.
Select Yes.