View your site's flowchart in Data Map
Use Data Map to get an overview of how your data flows through a Productsup site, featuring all data sources, data services, exports, and destinations.
Introduction
Data Map is a feature in Productsup that visualizes the flow of your product data within a site in an interactive flowchart. It shows the following information:
All main and additional data sources in a site.
All data services in a site.
All exports and destinations in a site.
Having a visual overview of where your data is coming from, how it is changed, and where it is exported can help you gain insights into the purpose of each site, quickly access the needed site elements, and identify potential improvements.
Locate Data Map
To locate the Data Map feature, take these steps:
Go to any desired site within your Productsup organization.
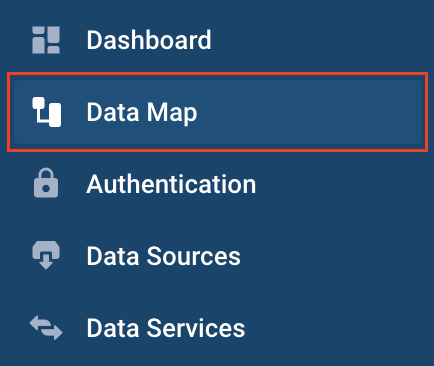
Open the navigation menu on the left and select Data Map. You can find it in the top half of the menu.
Read your site's flowchart in Data Map
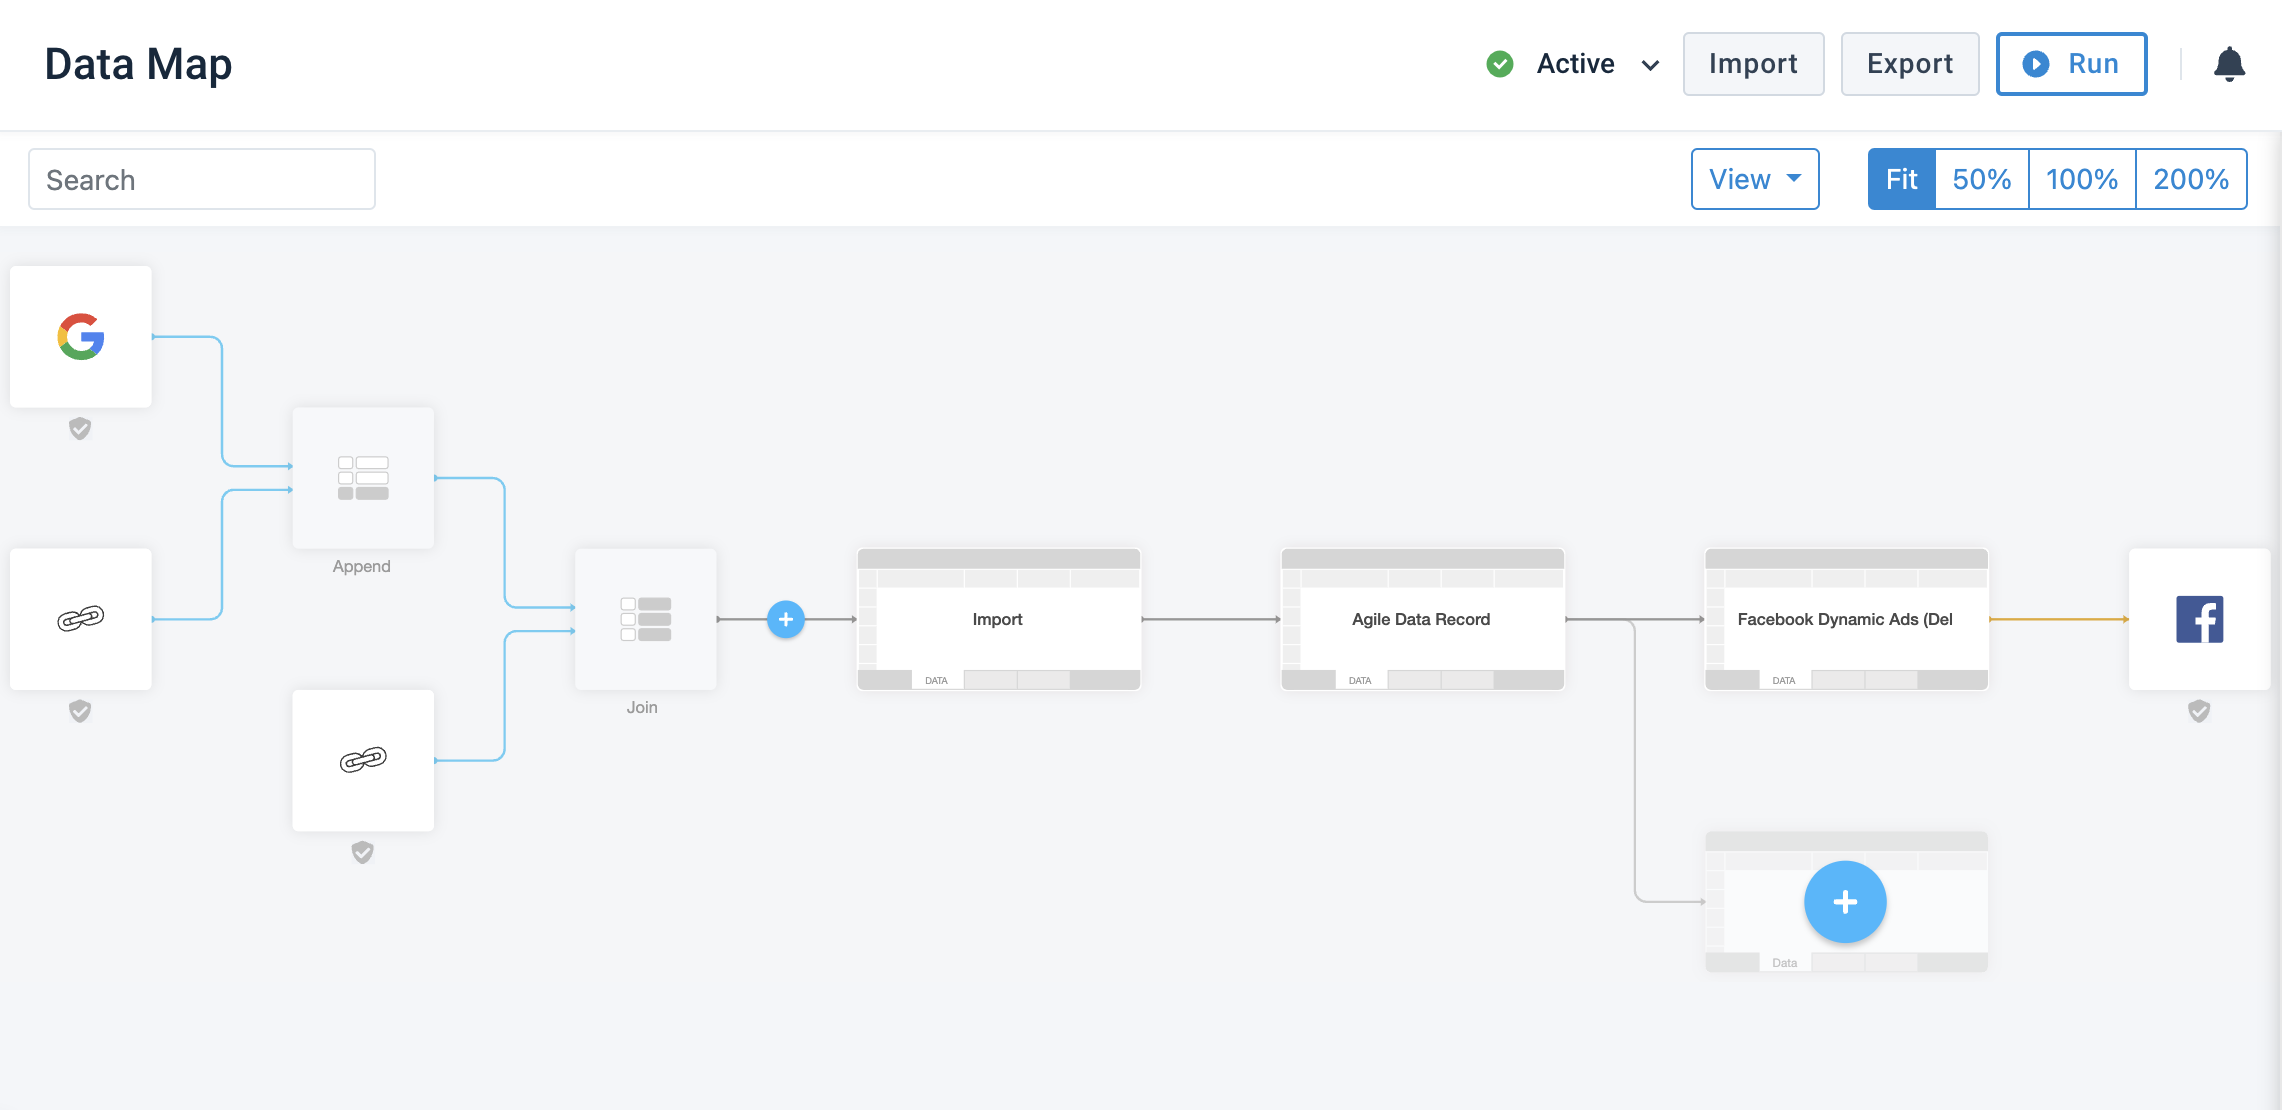
The Data Map feature visualizes your site's import, intermediate, and export stages. It provides information on what data sources and data services upload data to the import stage, what data services add or change your data at the intermediate stage, and what exports and destinations are present at the export stage.
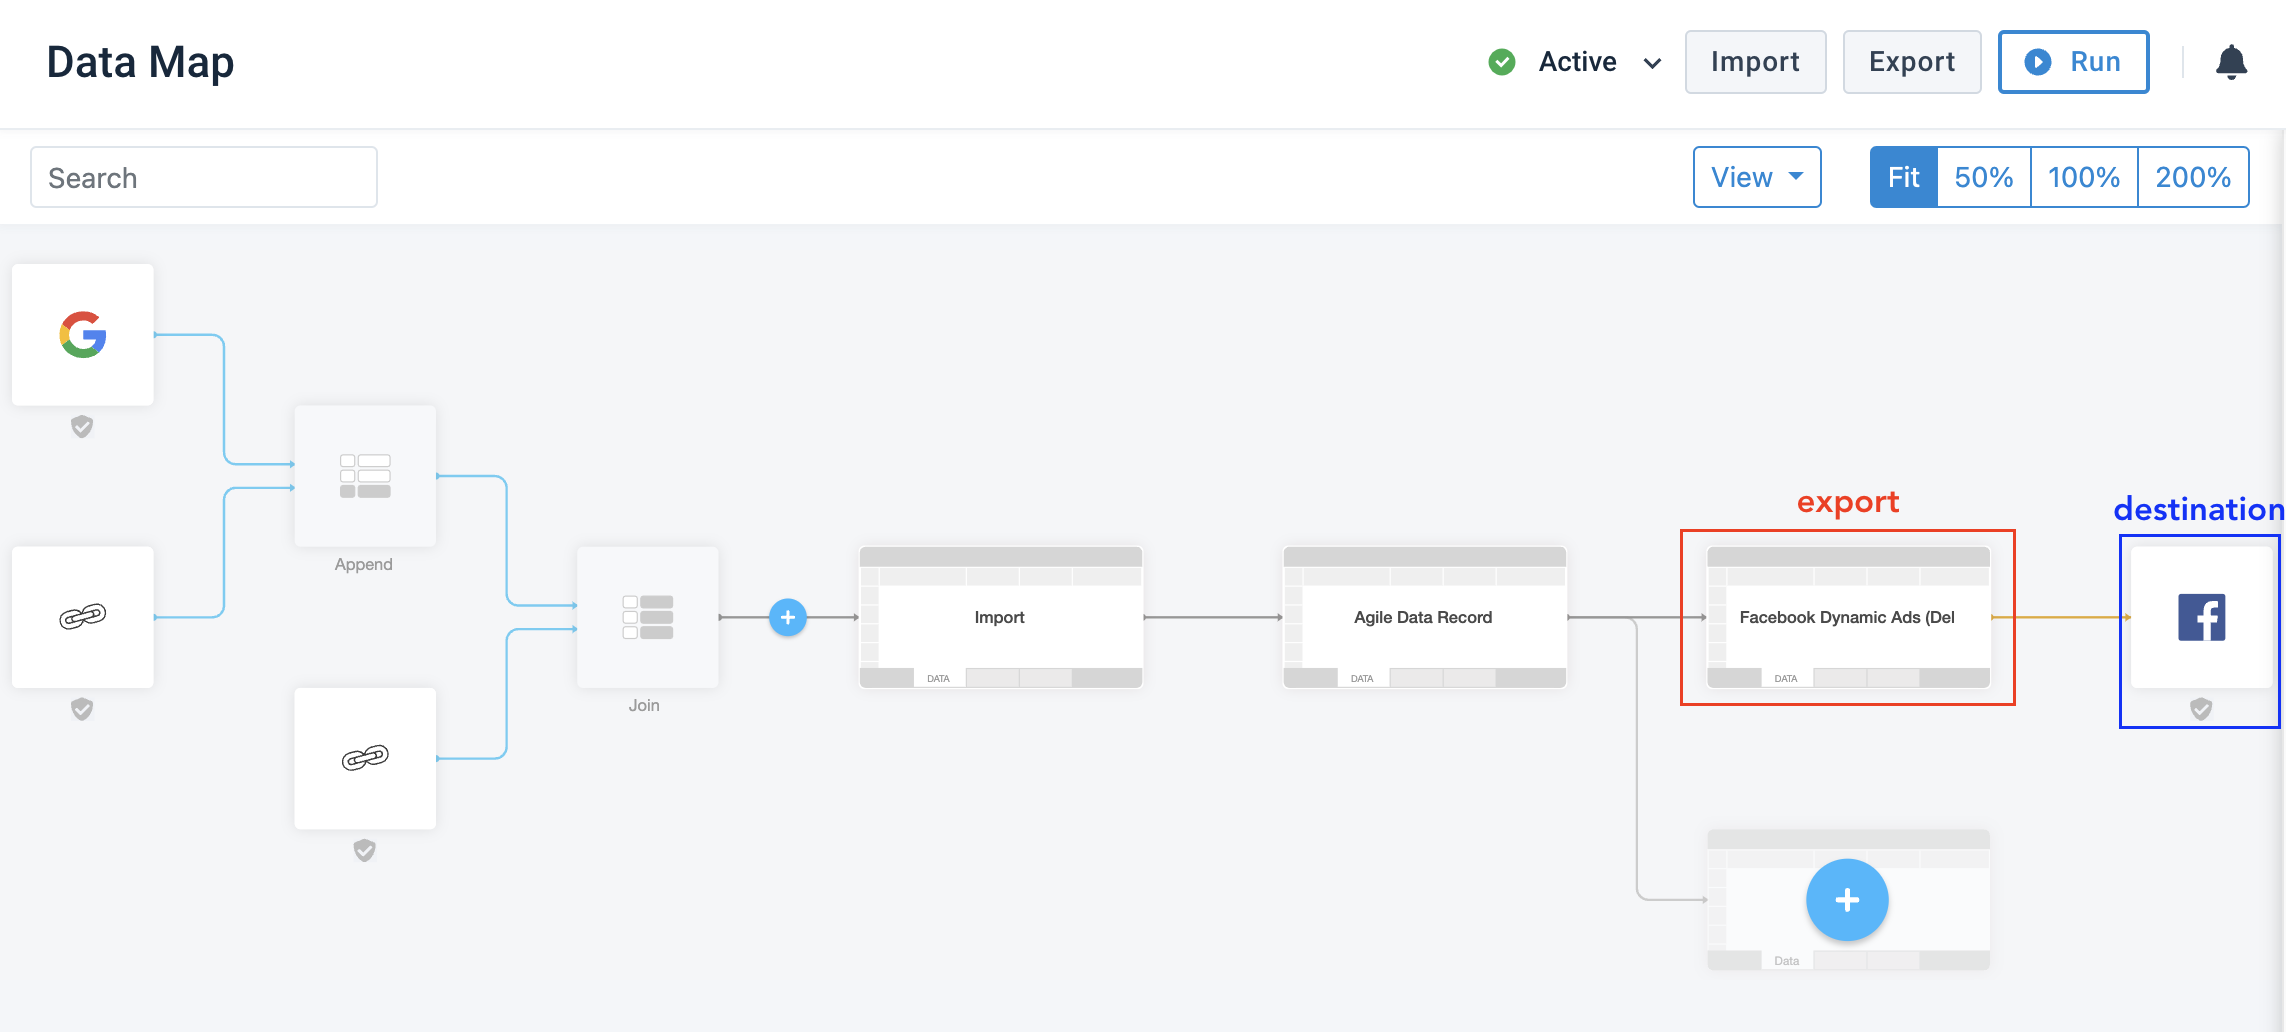
To show you how to read your site's flowchart in Data Map, here is a simple example with three data sources, one export, and one destination:
Data Map import stage
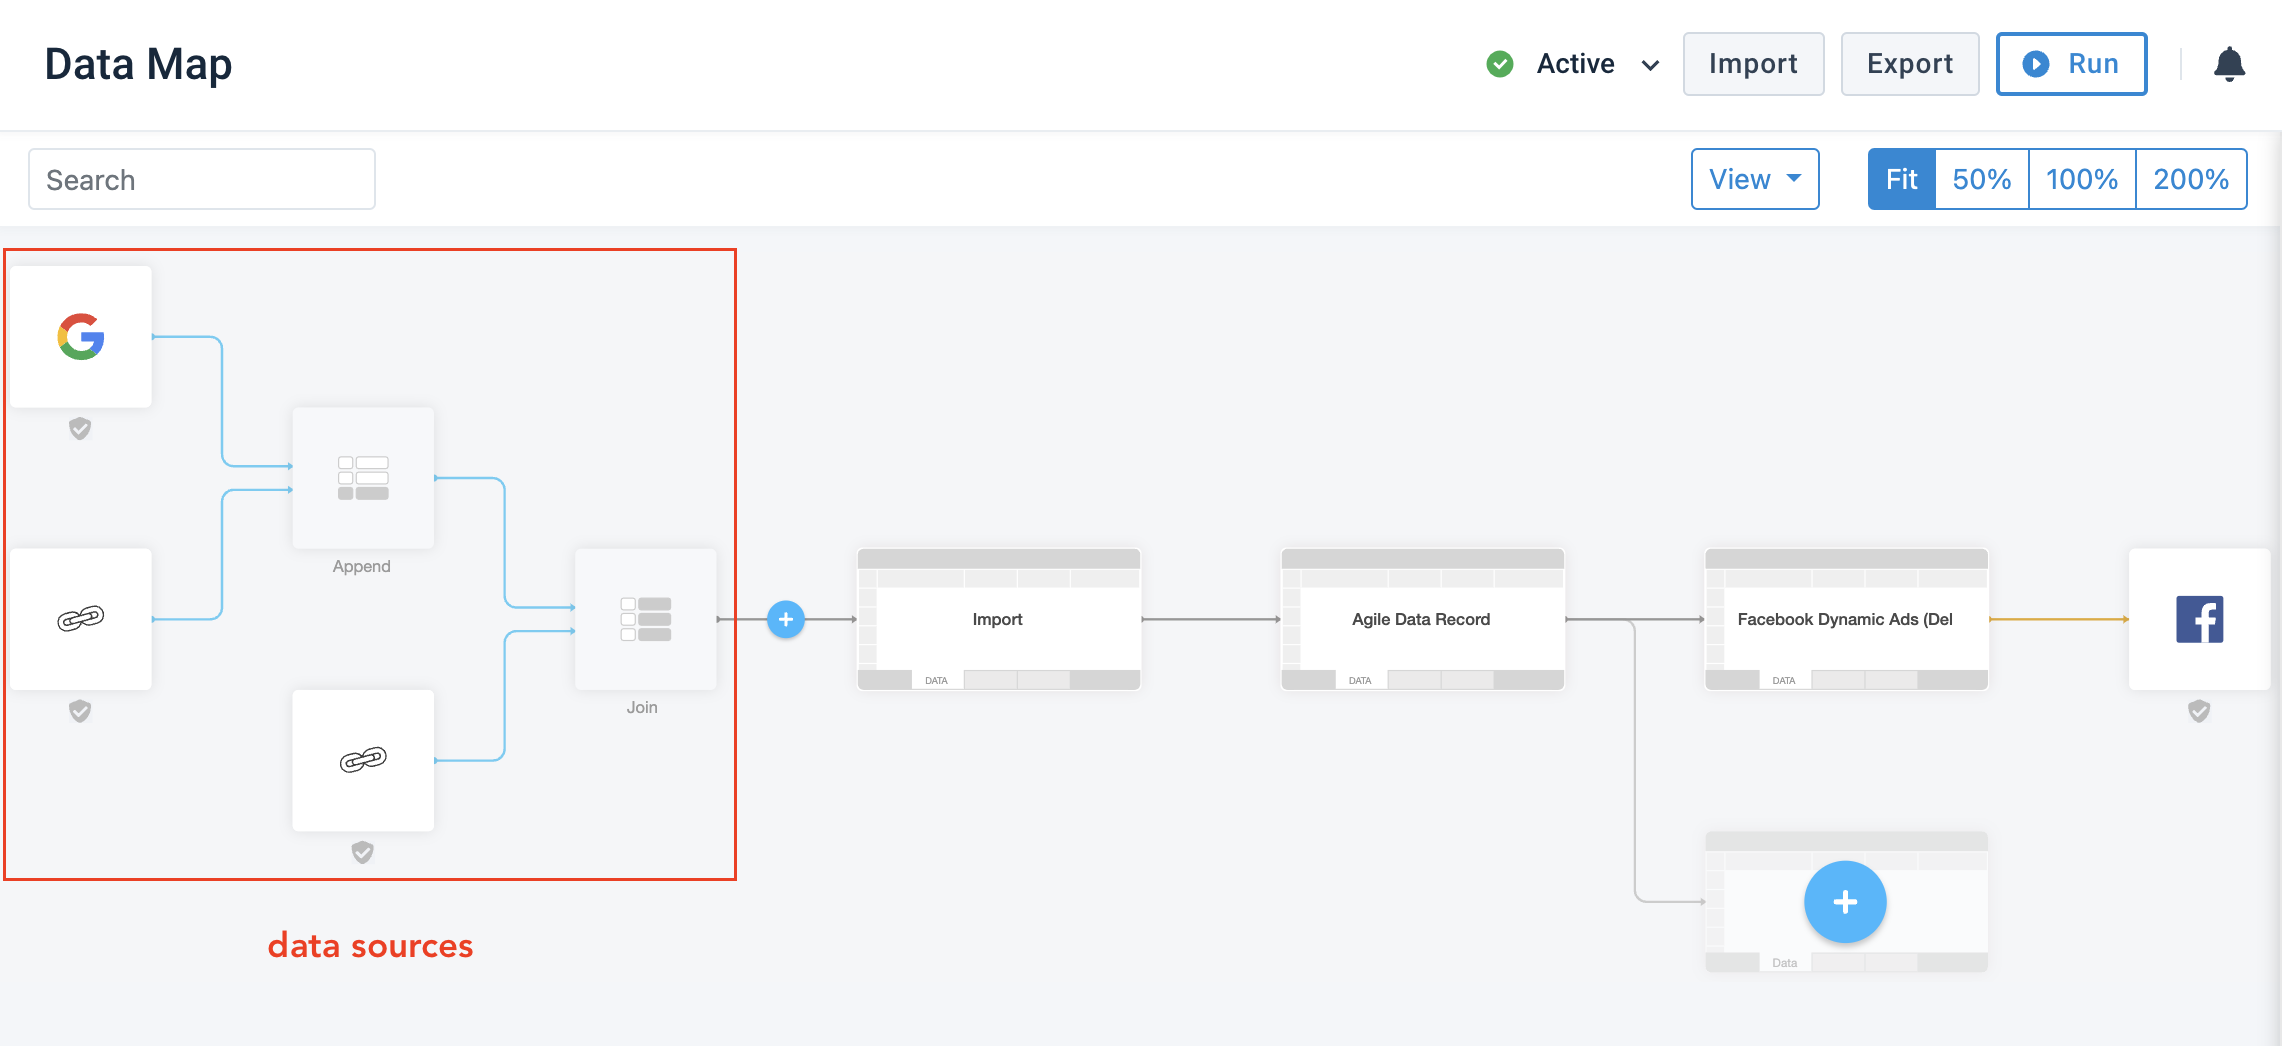
All the flowchart elements to the left of the Import block illustrate your site's import stage. The white blocks symbolize your data sources, and the gray blocks display the data source type:
Main data sources are connected to the gray block Append. Each data source attached to this block adds more products to your site.
Additional data sources are connected to the gray block Join. The data sources attached to the Join block only add more attributes to the products already existing in your site. See Enhance your data with additional data sources for a difference between main and additional data sources.
Tip
You can add a new data source right here in Data Map. Select the plus icon  to the left of the Import block to do so.
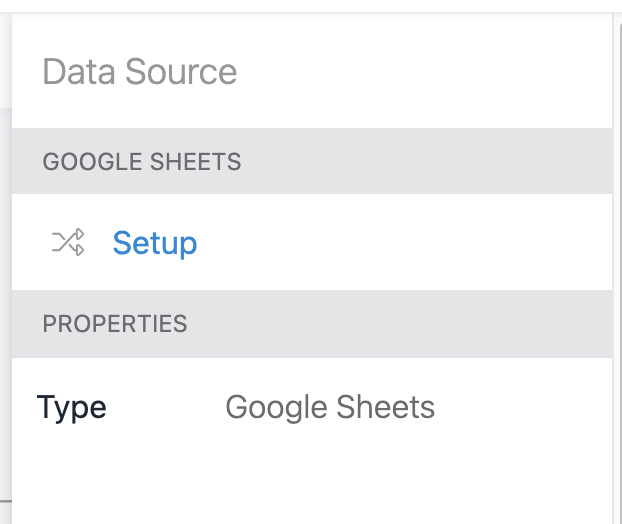
You can select a data source to open a sidebar menu, where you can see the type of your data source, such as Google Sheets or Feed URL, and use the Setup link to go directly to the setup page of the chosen data source.
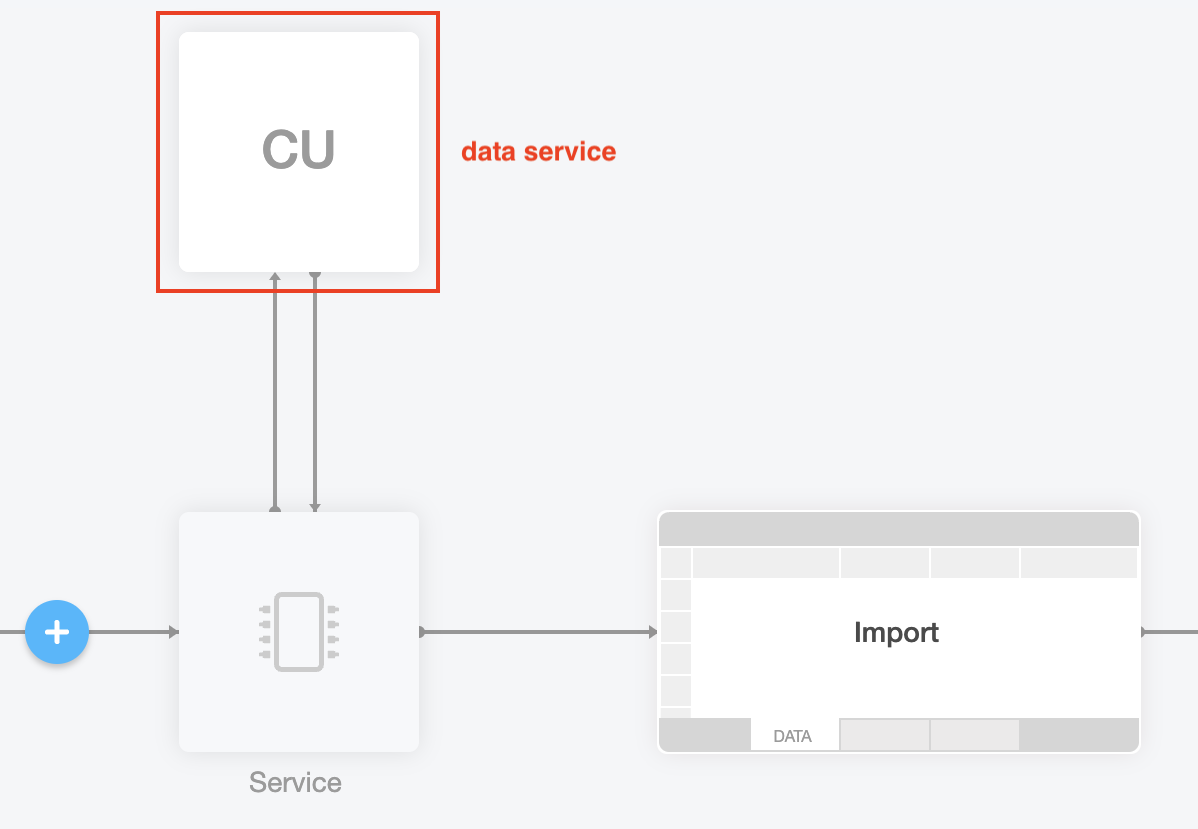
If you choose Data Map to display data services in your site's flowchart, you can see the data services applied at the import stage to the right of the Import block. See Configure the desired flowchart elements to enable data services in your flowchart.
You can select a data service to open a sidebar menu, where you can see the type of your data service, such as GROUP ATTRIBUTES or CURRENCY CONVERSION, and use the Setup link to go directly to the setup page of the chosen data service.
Data Map intermediate stage
The Agile Data Record block symbolizes your site's intermediate stage. You can select it to open the sidebar menu and go to the following places within your site:
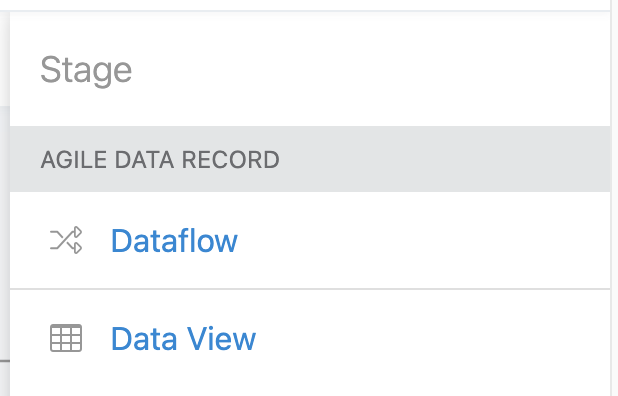
Select Dataflow to go to Dataflow.
Select Data View to go to the intermediate stage in Data View.
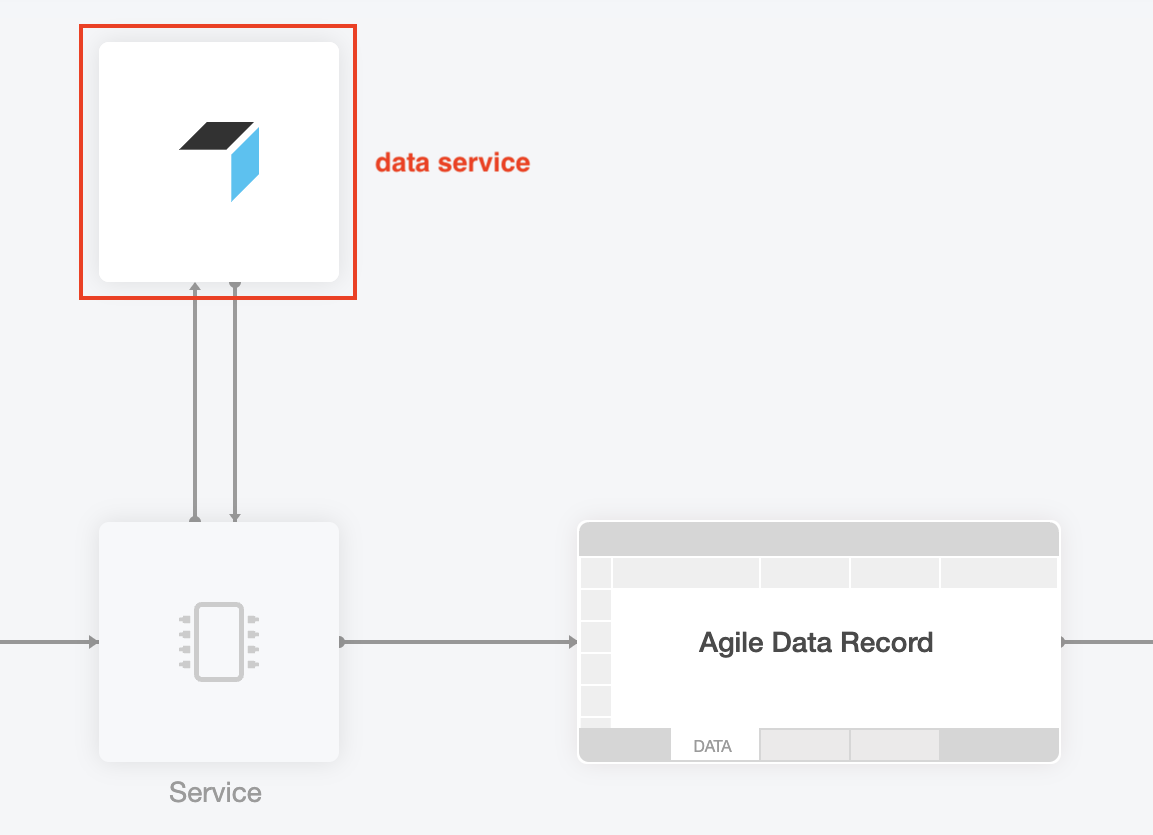
If you choose Data Map to display data services in your site's flowchart, you can see the data services applied at the intermediate stage to the left of the Agile Data Record block. See Configure the desired flowchart elements to enable data services in your flowchart.
You can select a data service to open a sidebar menu, where you can see the type of your data service, such as GROUP ATTRIBUTES or CURRENCY CONVERSION, and use the Setup link to go directly to the setup page of the chosen data service.
Data Map export stage
All the flowchart elements to the left of the Agile Data Record block illustrate your site's export stage. The stage blocks immediately after the Agile Data Record block symbolize the exports added in your site. Each export is then connected to its export destination.
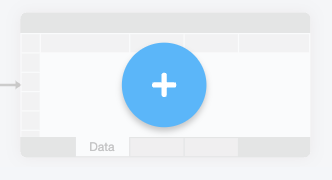
You can add a new export to your site at the bottom of the export section in Data Map. Select the plus icon in the last block to do so:
You can select any export in the flowchart to go to the following places within your site:
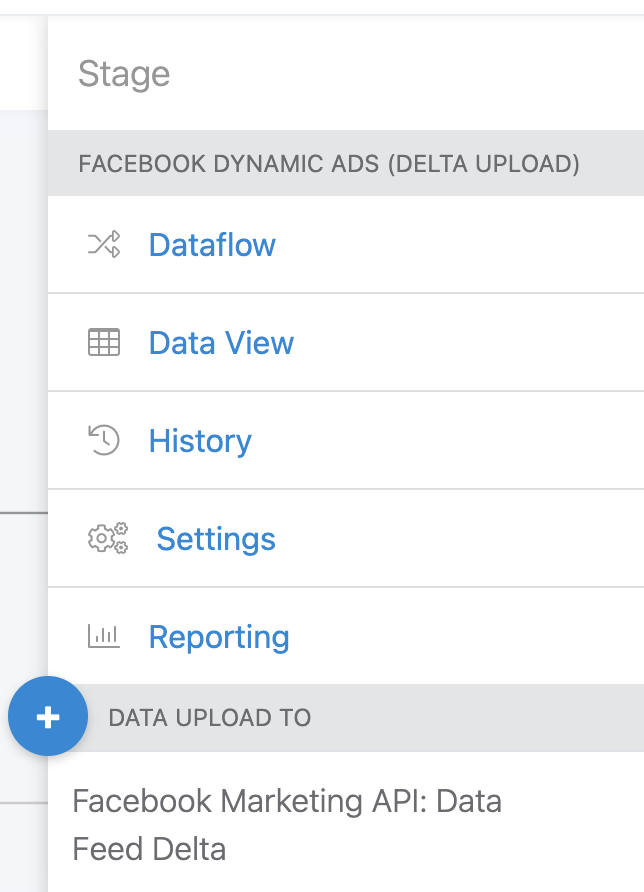
Select Dataflow to go to Dataflow.
Select Data View to go to the chosen export in Data View.
Select History to go to the Status page of the chosen export.
Select Settings to go to the setup page of the chosen export.
Select Reporting to go to the chosen export in Reporting.
In the DATA UPLOAD TO section of the sidebar menu, you can see the added destinations of the chosen export.
Tip
Select the plus icon  to the left of DATA UPLOAD TO in the sidebar menu to go to the export setup page, where you can add a destination.
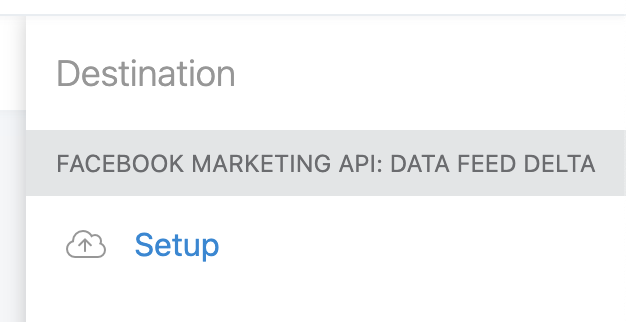
You can select any destination block to open a sidebar menu, where you can see the type of your destination, such as PRODUCTSUP SERVER or FACEBOOK MARKETING API: DATA FEED DELTA, and use the Setup link to go directly to the setup page of the chosen destination.
Use the search in Data Map
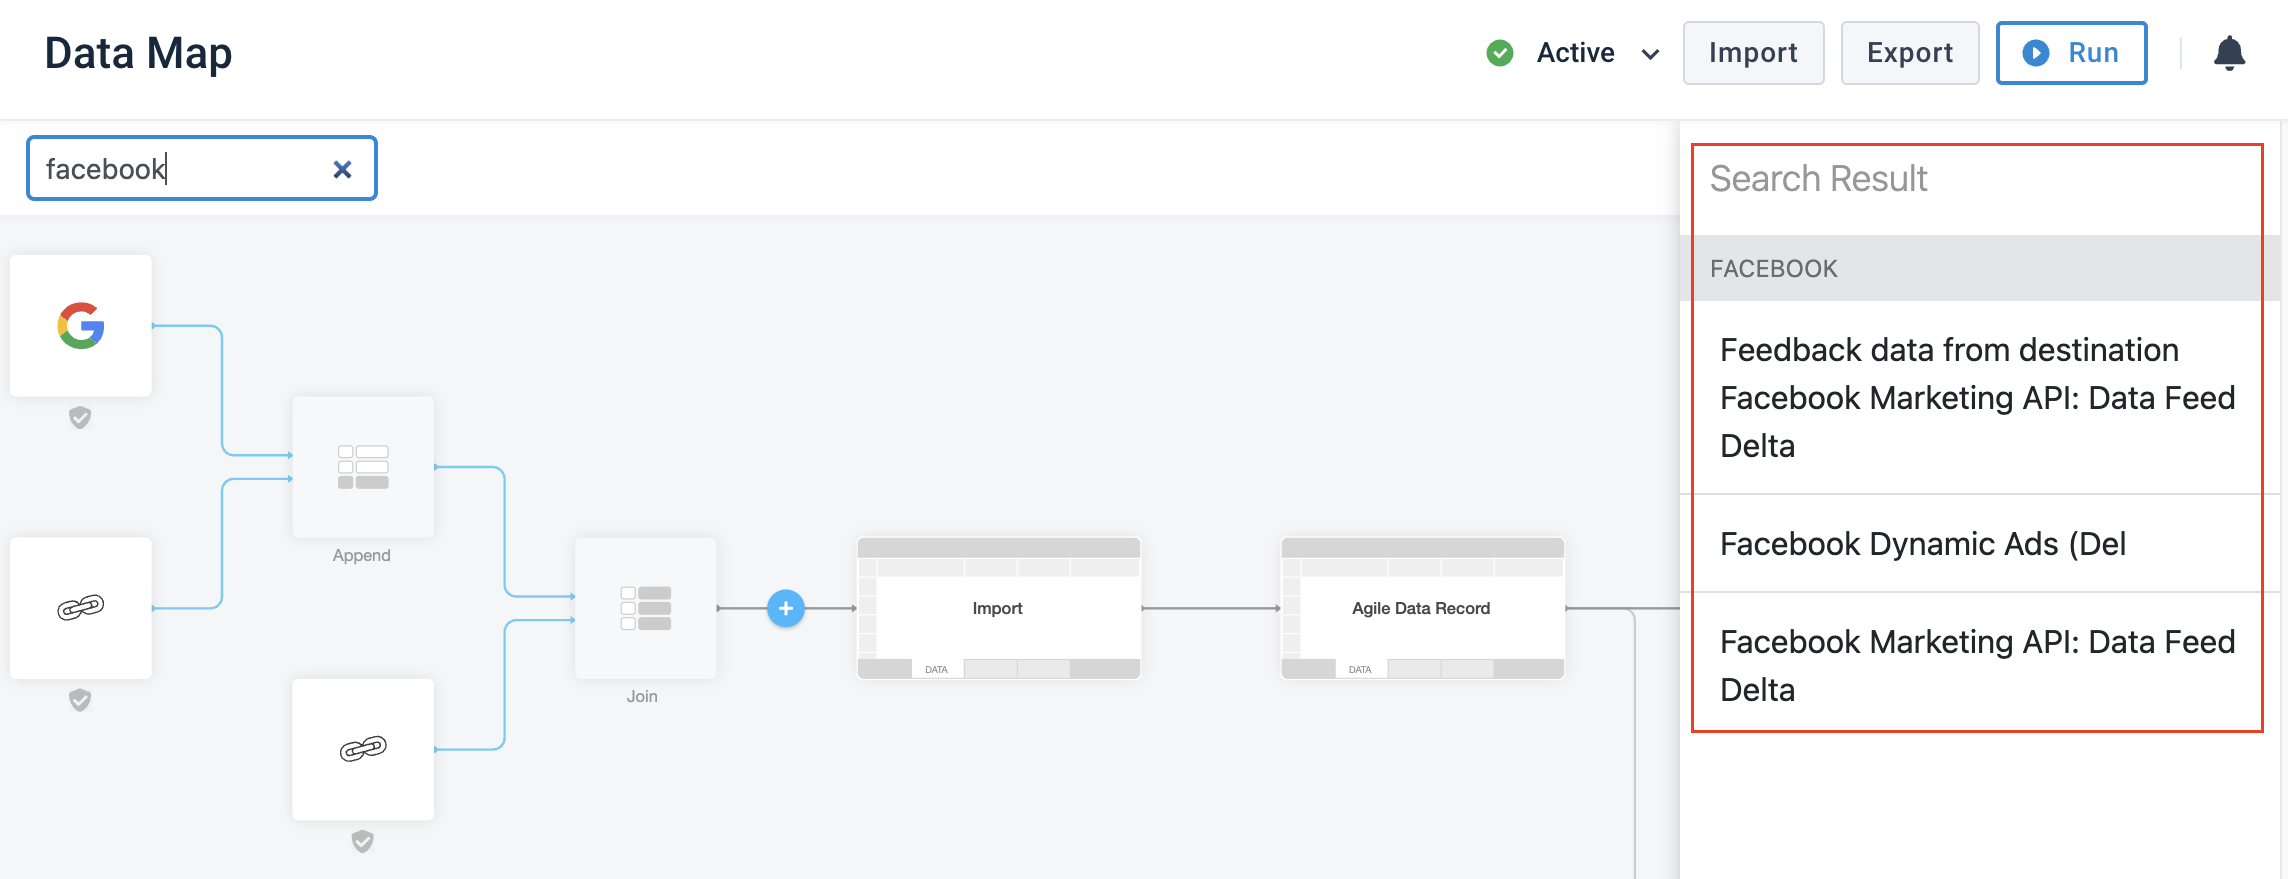
In a site with dozens of data sources, data services, exports, and destinations, you may need to find the desired site elements using the search bar at the top of the flowchart in Data Map. The results page opens up in a sidebar menu. If you select a result, Data Map guides you to the respective element in the flowchart and opens its relevant sidebar menu with quick links.
Configure the desired flowchart elements
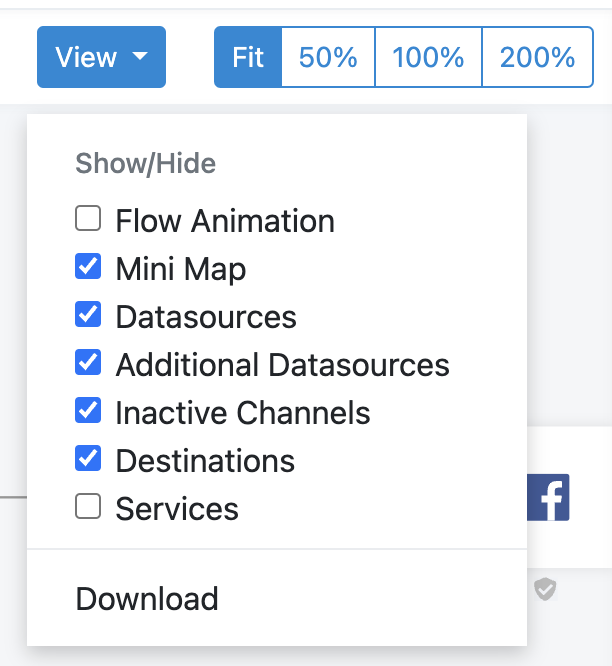
You can configure how Data Map displays your site's flowchart using the View drop-down menu and the scale options in the top-right corner of the page.

The default Fit option adjusts the flowchart to the size of your screen. Alternatively, you can zoom in or out by choosing 50%, 100%, or 200%.
In the View drop-down menu, you can choose which flowchart elements you want Data Map to display for your site:
Flow Animation animates the flow of your data between site elements.
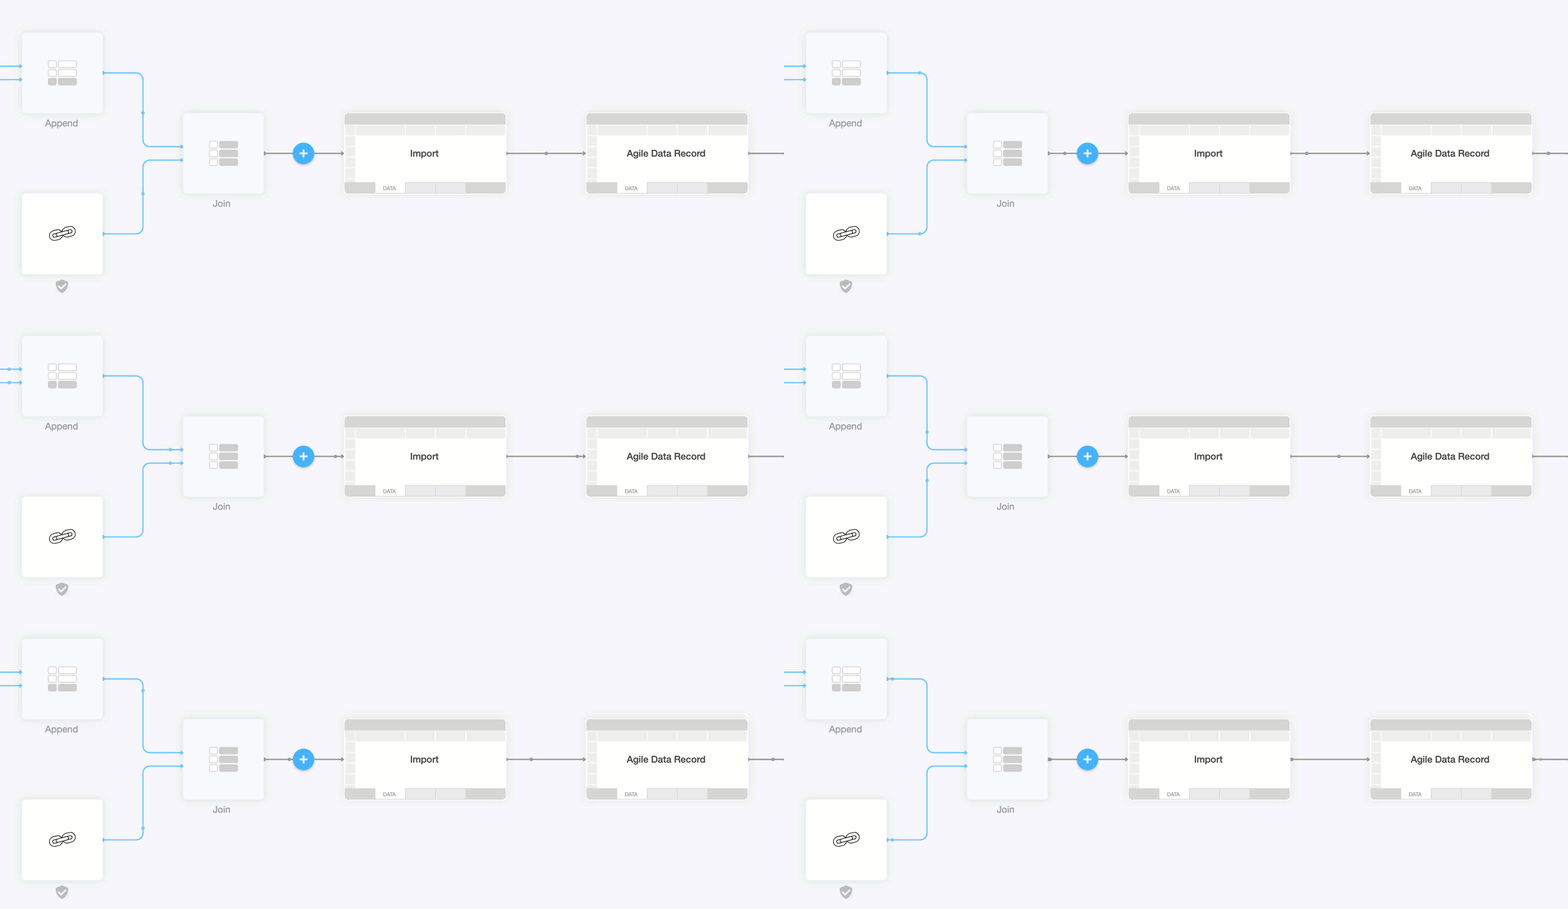
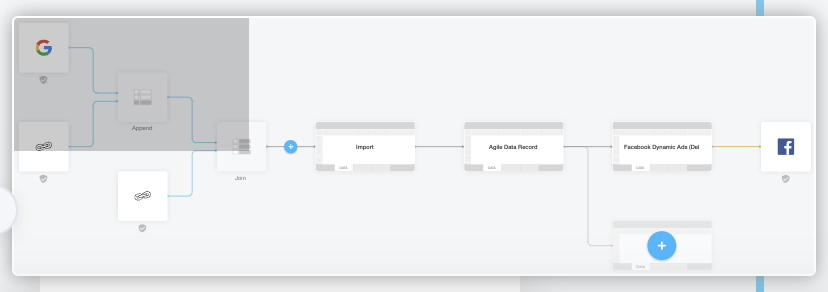
Mini Map adds a miniature version of your flowchart in the bottom-left corner of the page to help you navigate your flowchart. The gray zone in the miniature map shows your current location in the flowchart.
Datasources displays all added data sources in your flowchart. If you uncheck this box, the flowchart shows all data sources as one block.
Additional Datasources displays additional data sources in your flowchart. This option is only available if you check the option Datasources.
Inactive Channels displays all added exports in your flowchart, including inactive ones. Inactive exports don't export any data to their destinations.
Destinations displays all added destinations in your flowchart.
Services displays all added data services in your flowchart.
Tip
You can open the View drop-down menu and select Download to save your site's flowchart as a PNG file to your device.
Here is the default view in Data Map:
