View your Activity Log and Summary
Activity Log and Activity Summary: Learn how to get an overview of your imported and exported items, applied rule boxes, created connections, and more actions in your sites using the Activity feature in Productsup.
With the Activity feature, you can keep track of the following:
All your applied, edited, scheduled, and deleted rule boxes.
All rule box conditions added to, moved within, or deleted from attributes.
All added and deleted connections in Dataflow.
All added, edited, and deleted user-generated attributes.
The number of monthly maintained and exported items.
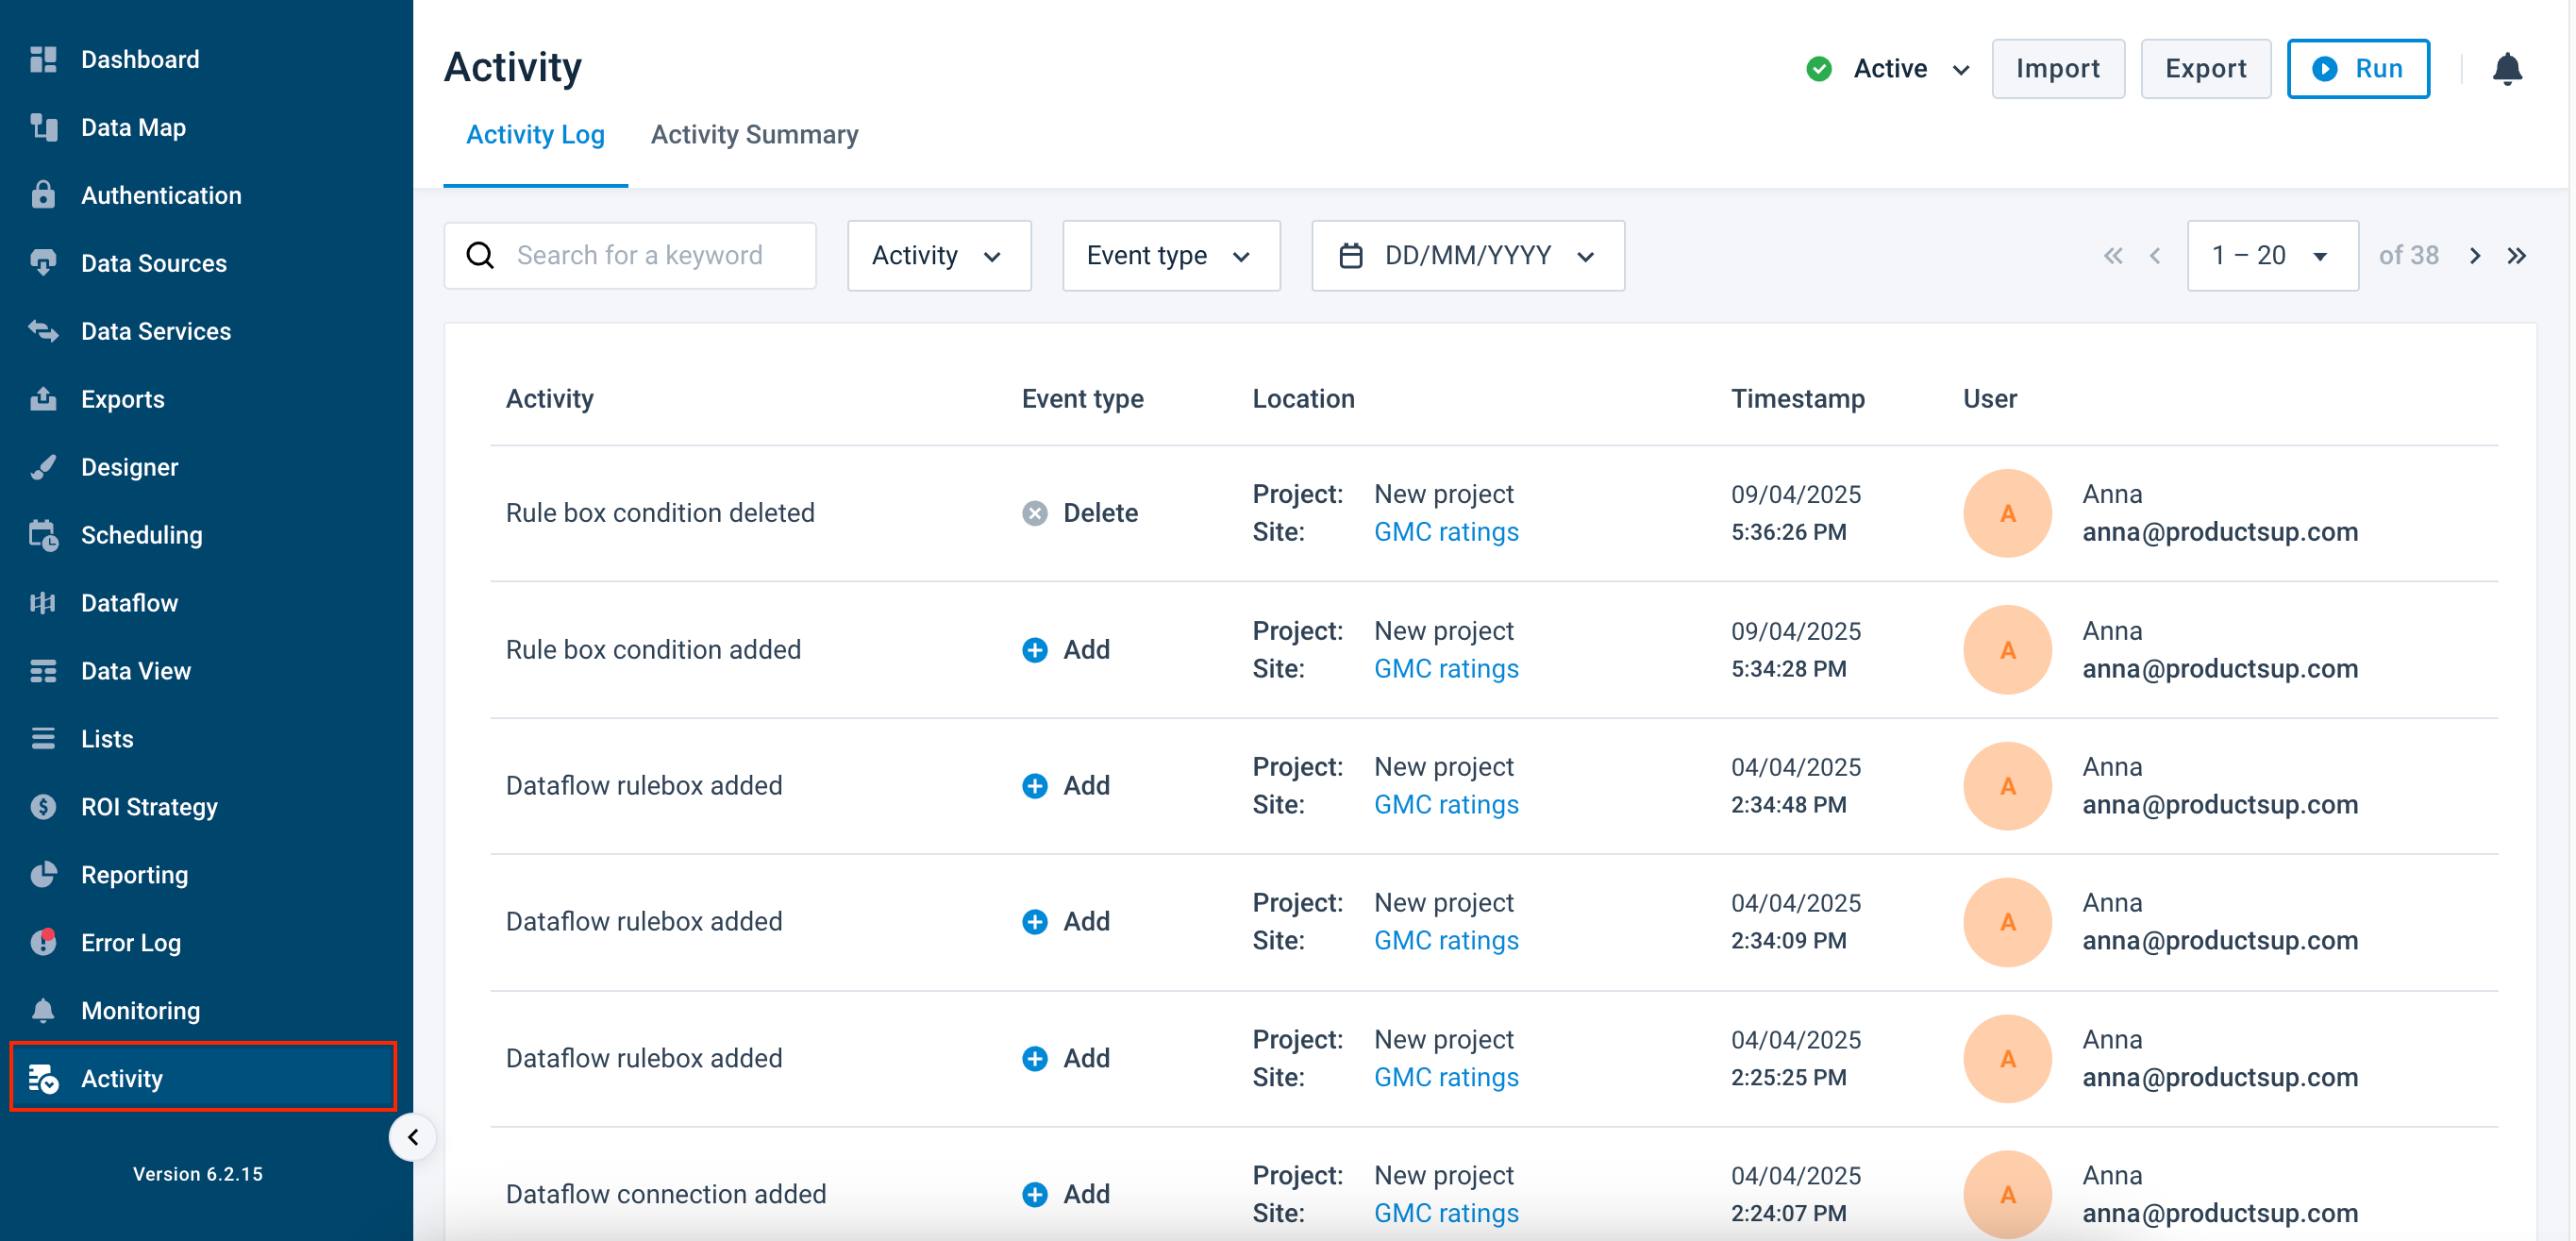
Locate the Activity page
To access the Activity page, go to Activity from your organization's, project's, or site's main menu.
If you access the Activity page from the organization or site level, you can see two tabs:
The Activity Log tab displays all activities related to rule boxes, connections, rule box conditions, and user-generated attributes.
The Activity Summary tab shows the number of monthly maintained and exported items for the organization.
If you access the Activity page from the project level, you can see only the Activity Summary tab with the number of monthly maintained and exported items for each site in a project.
Activity Log
Activity Log displays your users' activities in Dataflow and Data View:
Adding, editing, pausing, scheduling, or deleting rule boxes.
Applying rule box conditions to attributes, moving them within attributes, or removing them from attributes.
Adding or deleting connections in Dataflow.
Adding, editing, and deleting user-generated attributes.
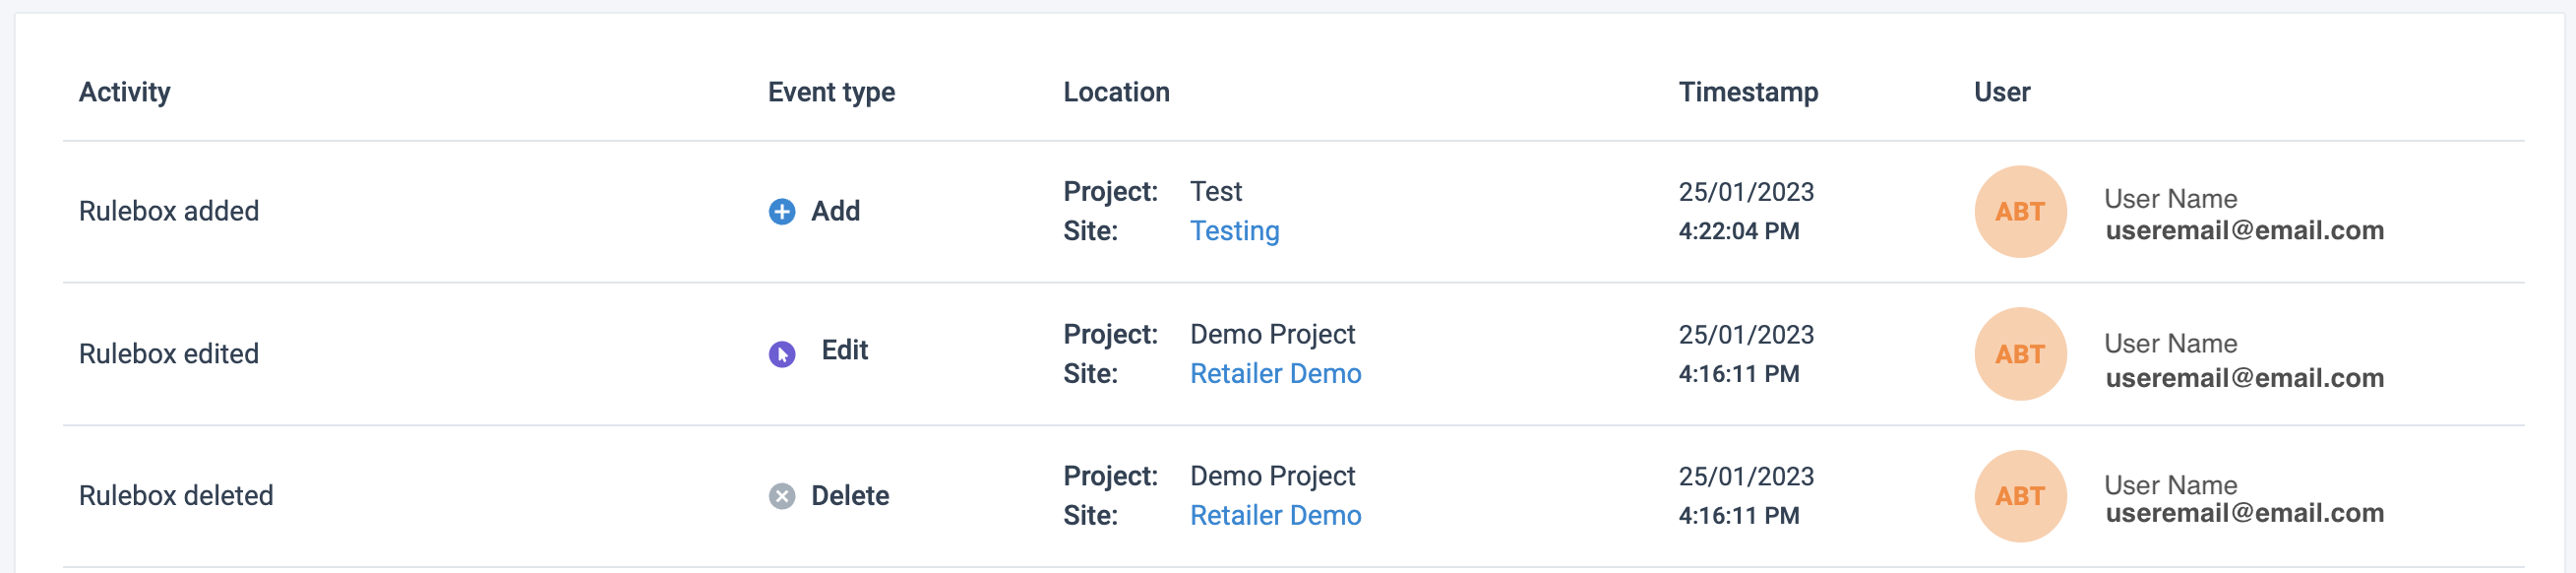
Your Activity Log displays a table containing the following information:
Activity shows the name of the logged activity.
Type displays the type of performed activity, such as Add, Edit, Order change, and Delete. The current version doesn't show the scheduling of rule boxes and changes of Dataflow versions.
Location shows the project and site of the activity.
Timestamp displays the time when the activity occurred based on the time zone selected in your profile. See Set up user profile time zone.
User records the name and email of the user who performed the activity.
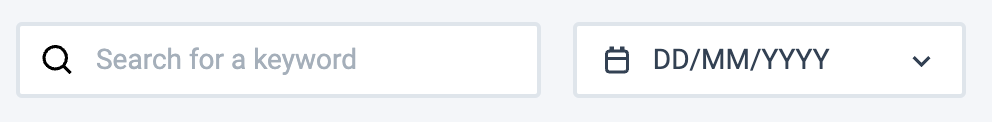
Search for the needed user activities in the top toolbar
You can search for the needed user activities using the search bar or the filters displayed next to it:
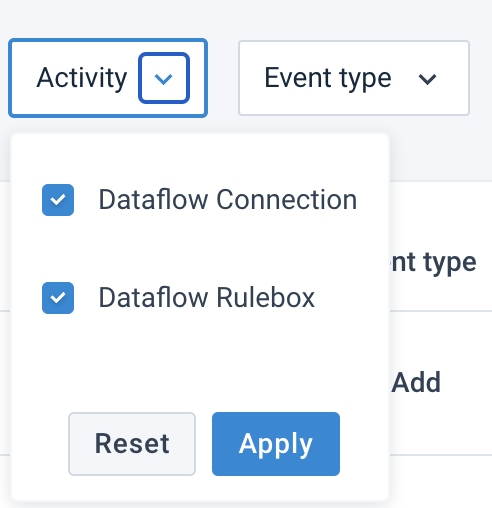
In Activity, choose the entity that the needed activity relates to and select Apply:
Dataflow connection shows an added or deleted connection between attributes in Dataflow.
Dataflow rule box shows a rule box added, edited, moved, or deleted in Data View or Dataflow.
Rule box condition shows an applied, moved, or deleted rule box condition in Data View or Dataflow.
User-generated attribute shows an added, edited, or deleted attribute in the intermediate or export stage in Dataflow.
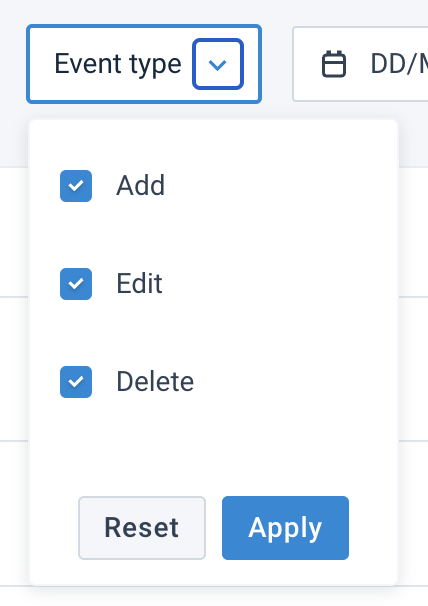
In Type, choose the needed type of activity and select Apply:
Add shows activities where a user added a rule box, a connection, a rule box condition, or a user-generated attribute.
Edit shows activities where a user changed a rule box setup or renamed a user-generated attribute.
Order change shows activities where a user changed the order of rule boxes and rule box conditions in an attribute.
Delete shows activities where a user deleted a rule box, a connection, a rule box condition, or a user-generated attribute.
See the activity details
Select any activity in Activity Log to view its details:
The rule box activity details page shows the following information:
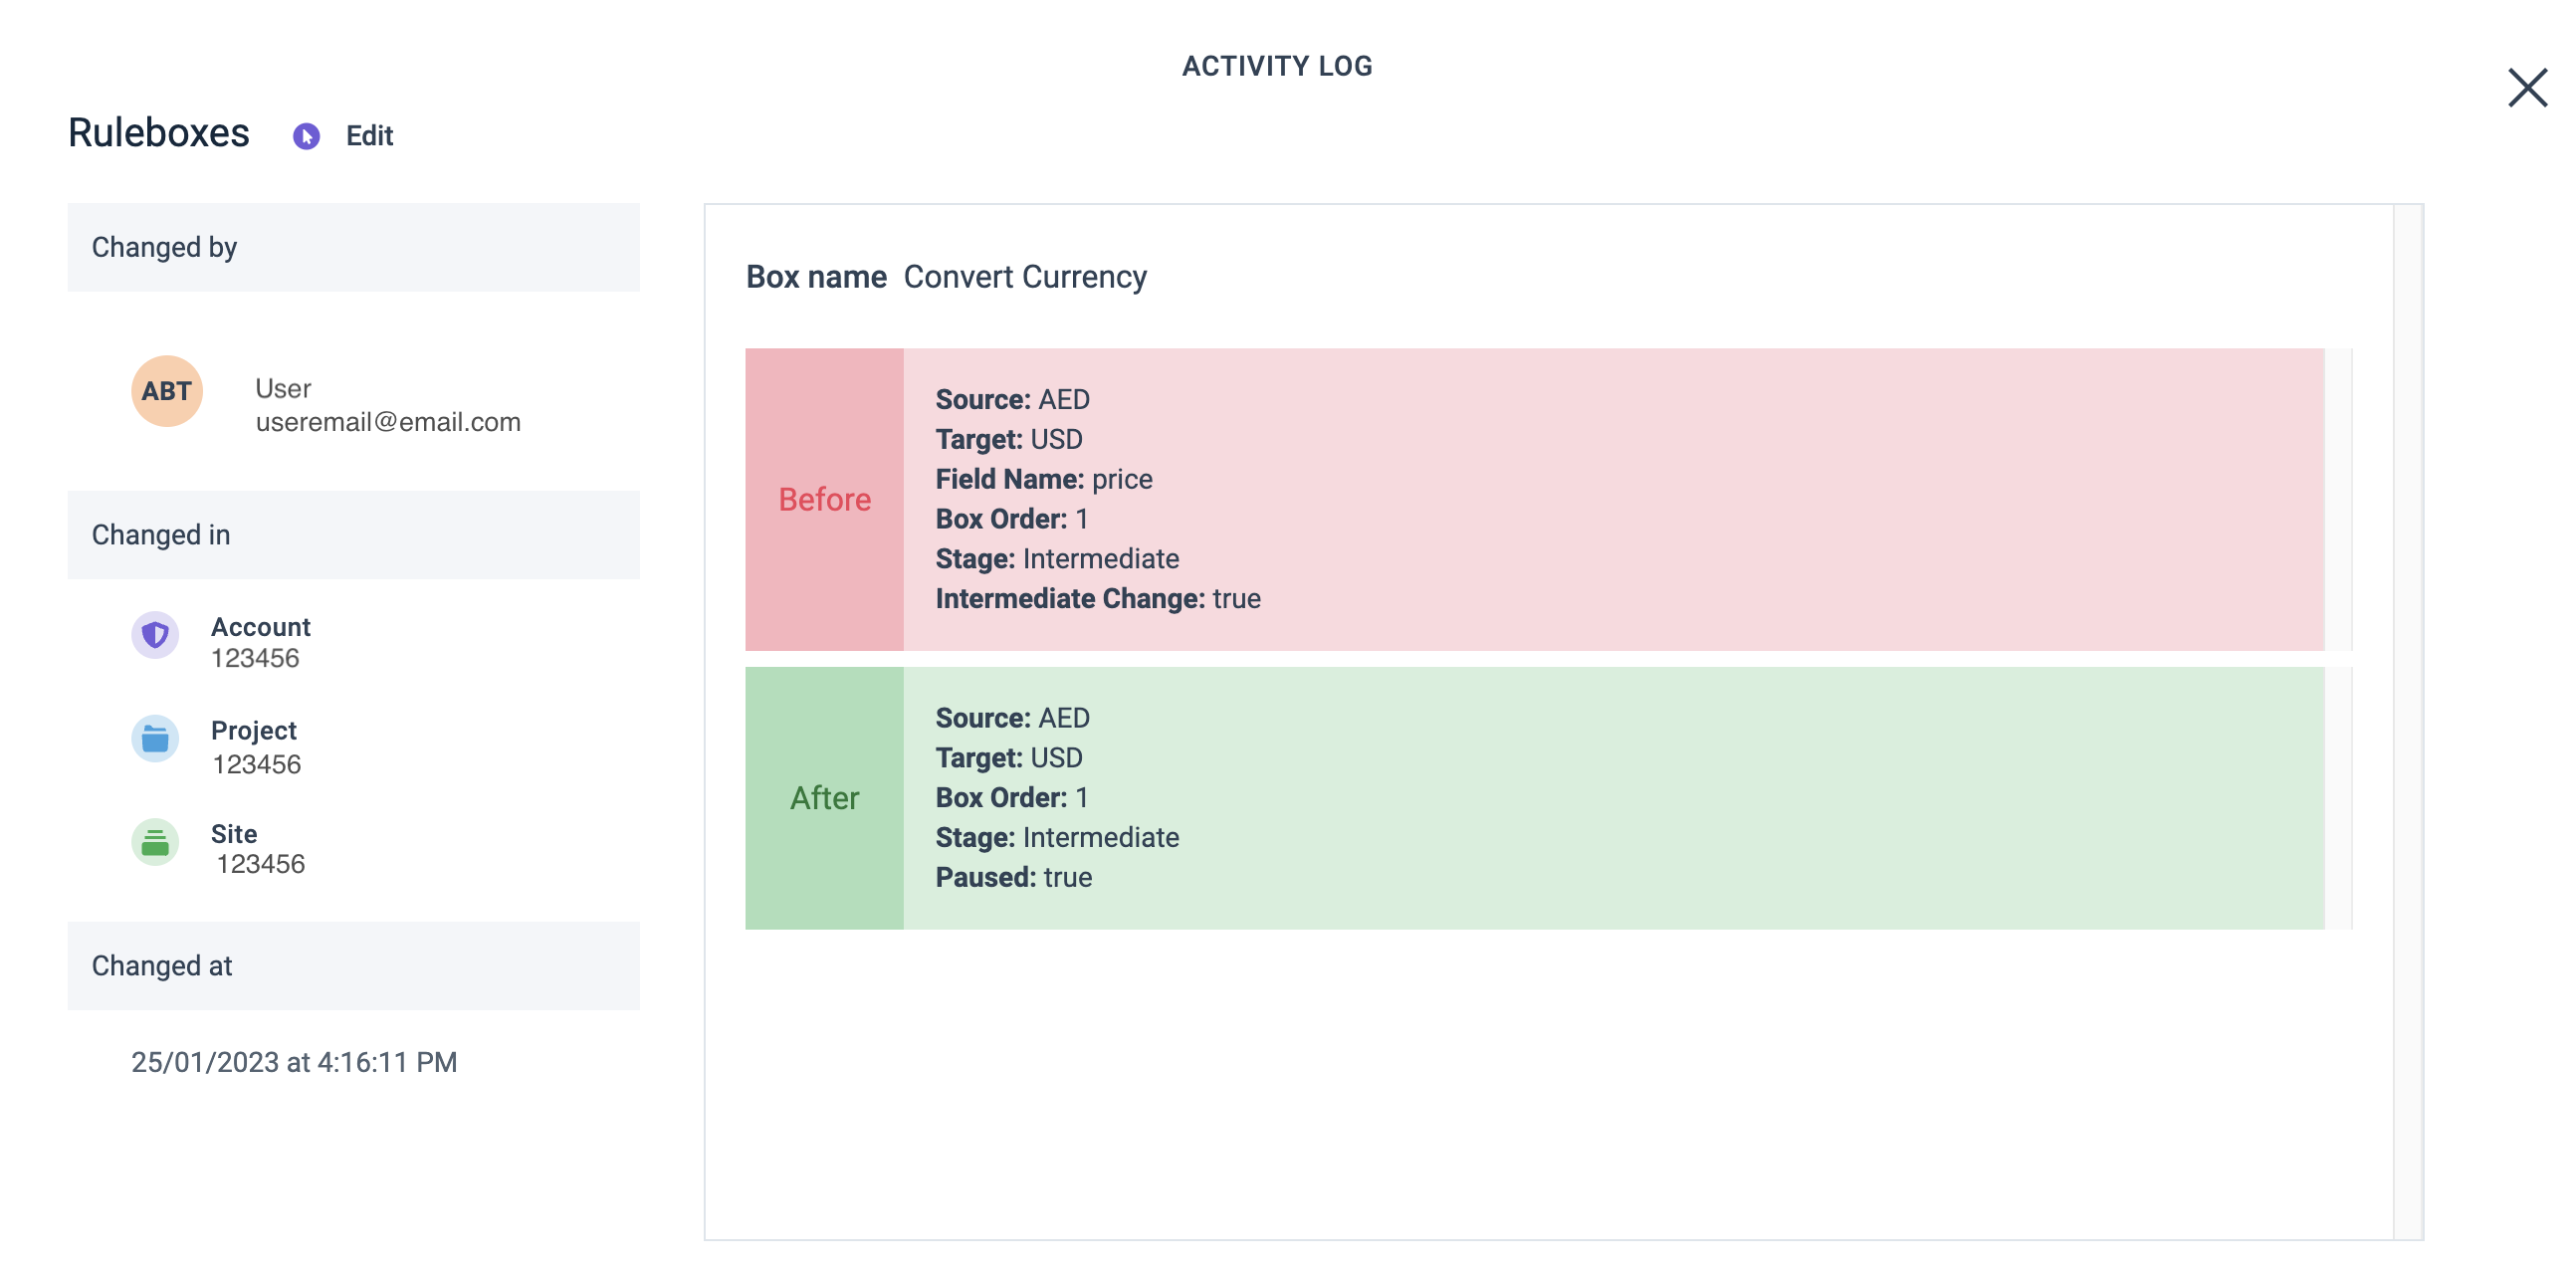
Add, Edit, Order change, and Delete identify the type of action related to the rule box.
User shows the user who performed the change.
Location displays the organization, project, and site where the change happened.
Timestamp logs the time of the change.
Rule box name shows which rule box relates to the change.
The Before and After panels display:
The settings of the rule box before and after the change. This is only visible for Edit activities.
In Attribute Name, the attribute where a user applied the rule box.
In Rule Box Order, the number indicating the order in which a user applied the rule box to the attribute. See Rule box order.
In Stage, the stage or export where a user applied the rule box.
The activity details page of a Dataflow connection shows the following information:
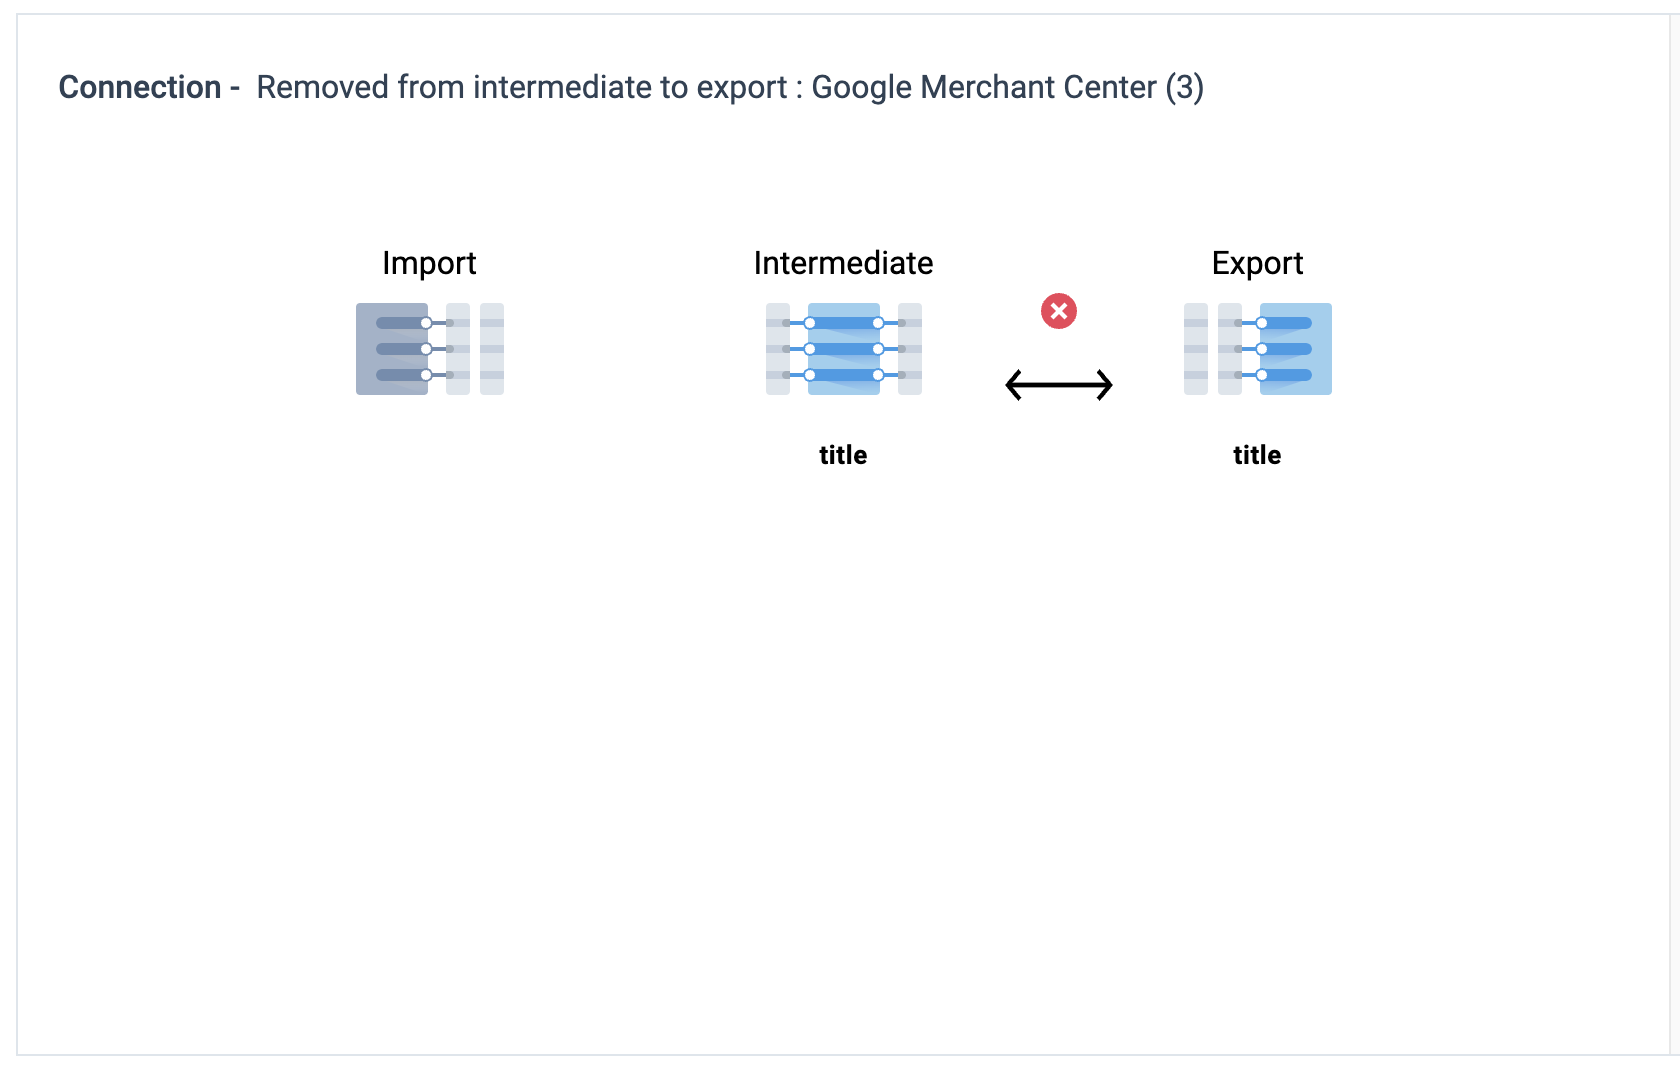
Add and Delete identify the type of activity related to the connection in Dataflow.
User shows the user who performed the change.
Location displays the organization, project, and site where the change happened.
Timestamp logs the time of the change.
Connection shows the stages where the connection changed. If the connection changed between the intermediate and export stages, you can also see the name of the specific export related to the change.
The names of the attributes between which a user changed the connection.
The activity details page of a rule box condition shows the following information:
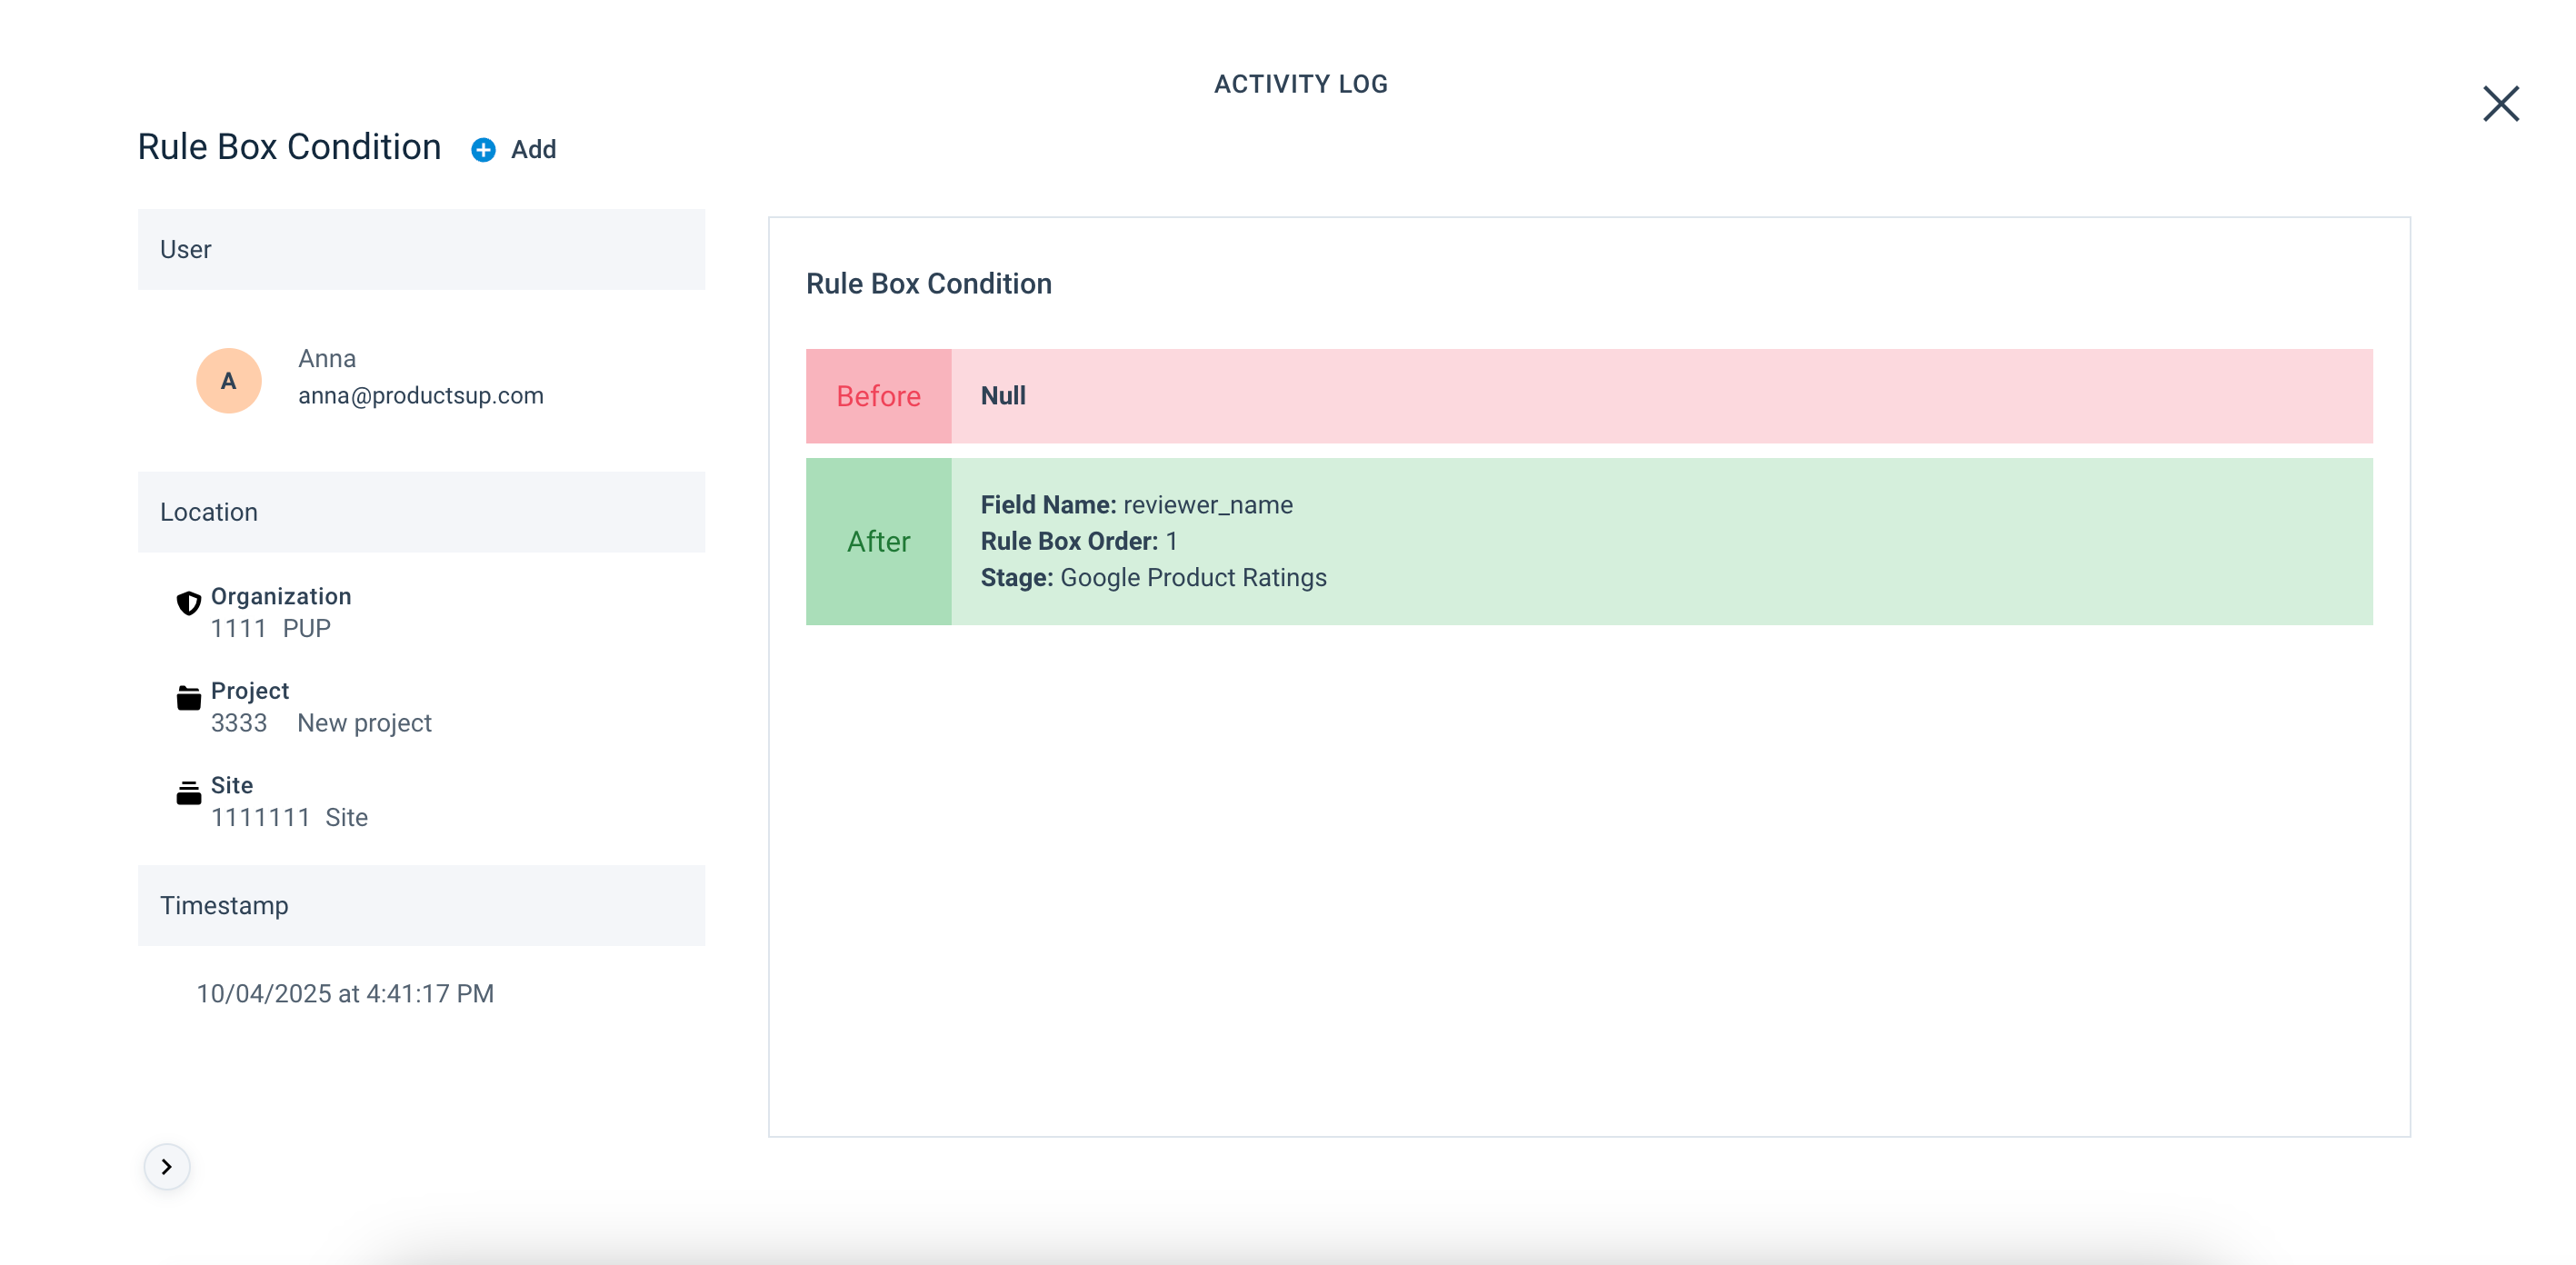
Add, Order change, and Delete identify the type of activity related to the rule box condition.
User shows the user who performed the change.
Location displays the organization, project, and site where the change happened.
Timestamp logs the time of the change.
The Before and After panels display:
In Attribute Name, the attribute where a user applied the rule box condition.
In Rule Box Order, the number indicating the order in which a user applied the rule box condition to the attribute. See Rule box order.
In Stage, the stage or export where a user applied the rule box condition.
The activity details page of a user-generated attribute shows the following information:
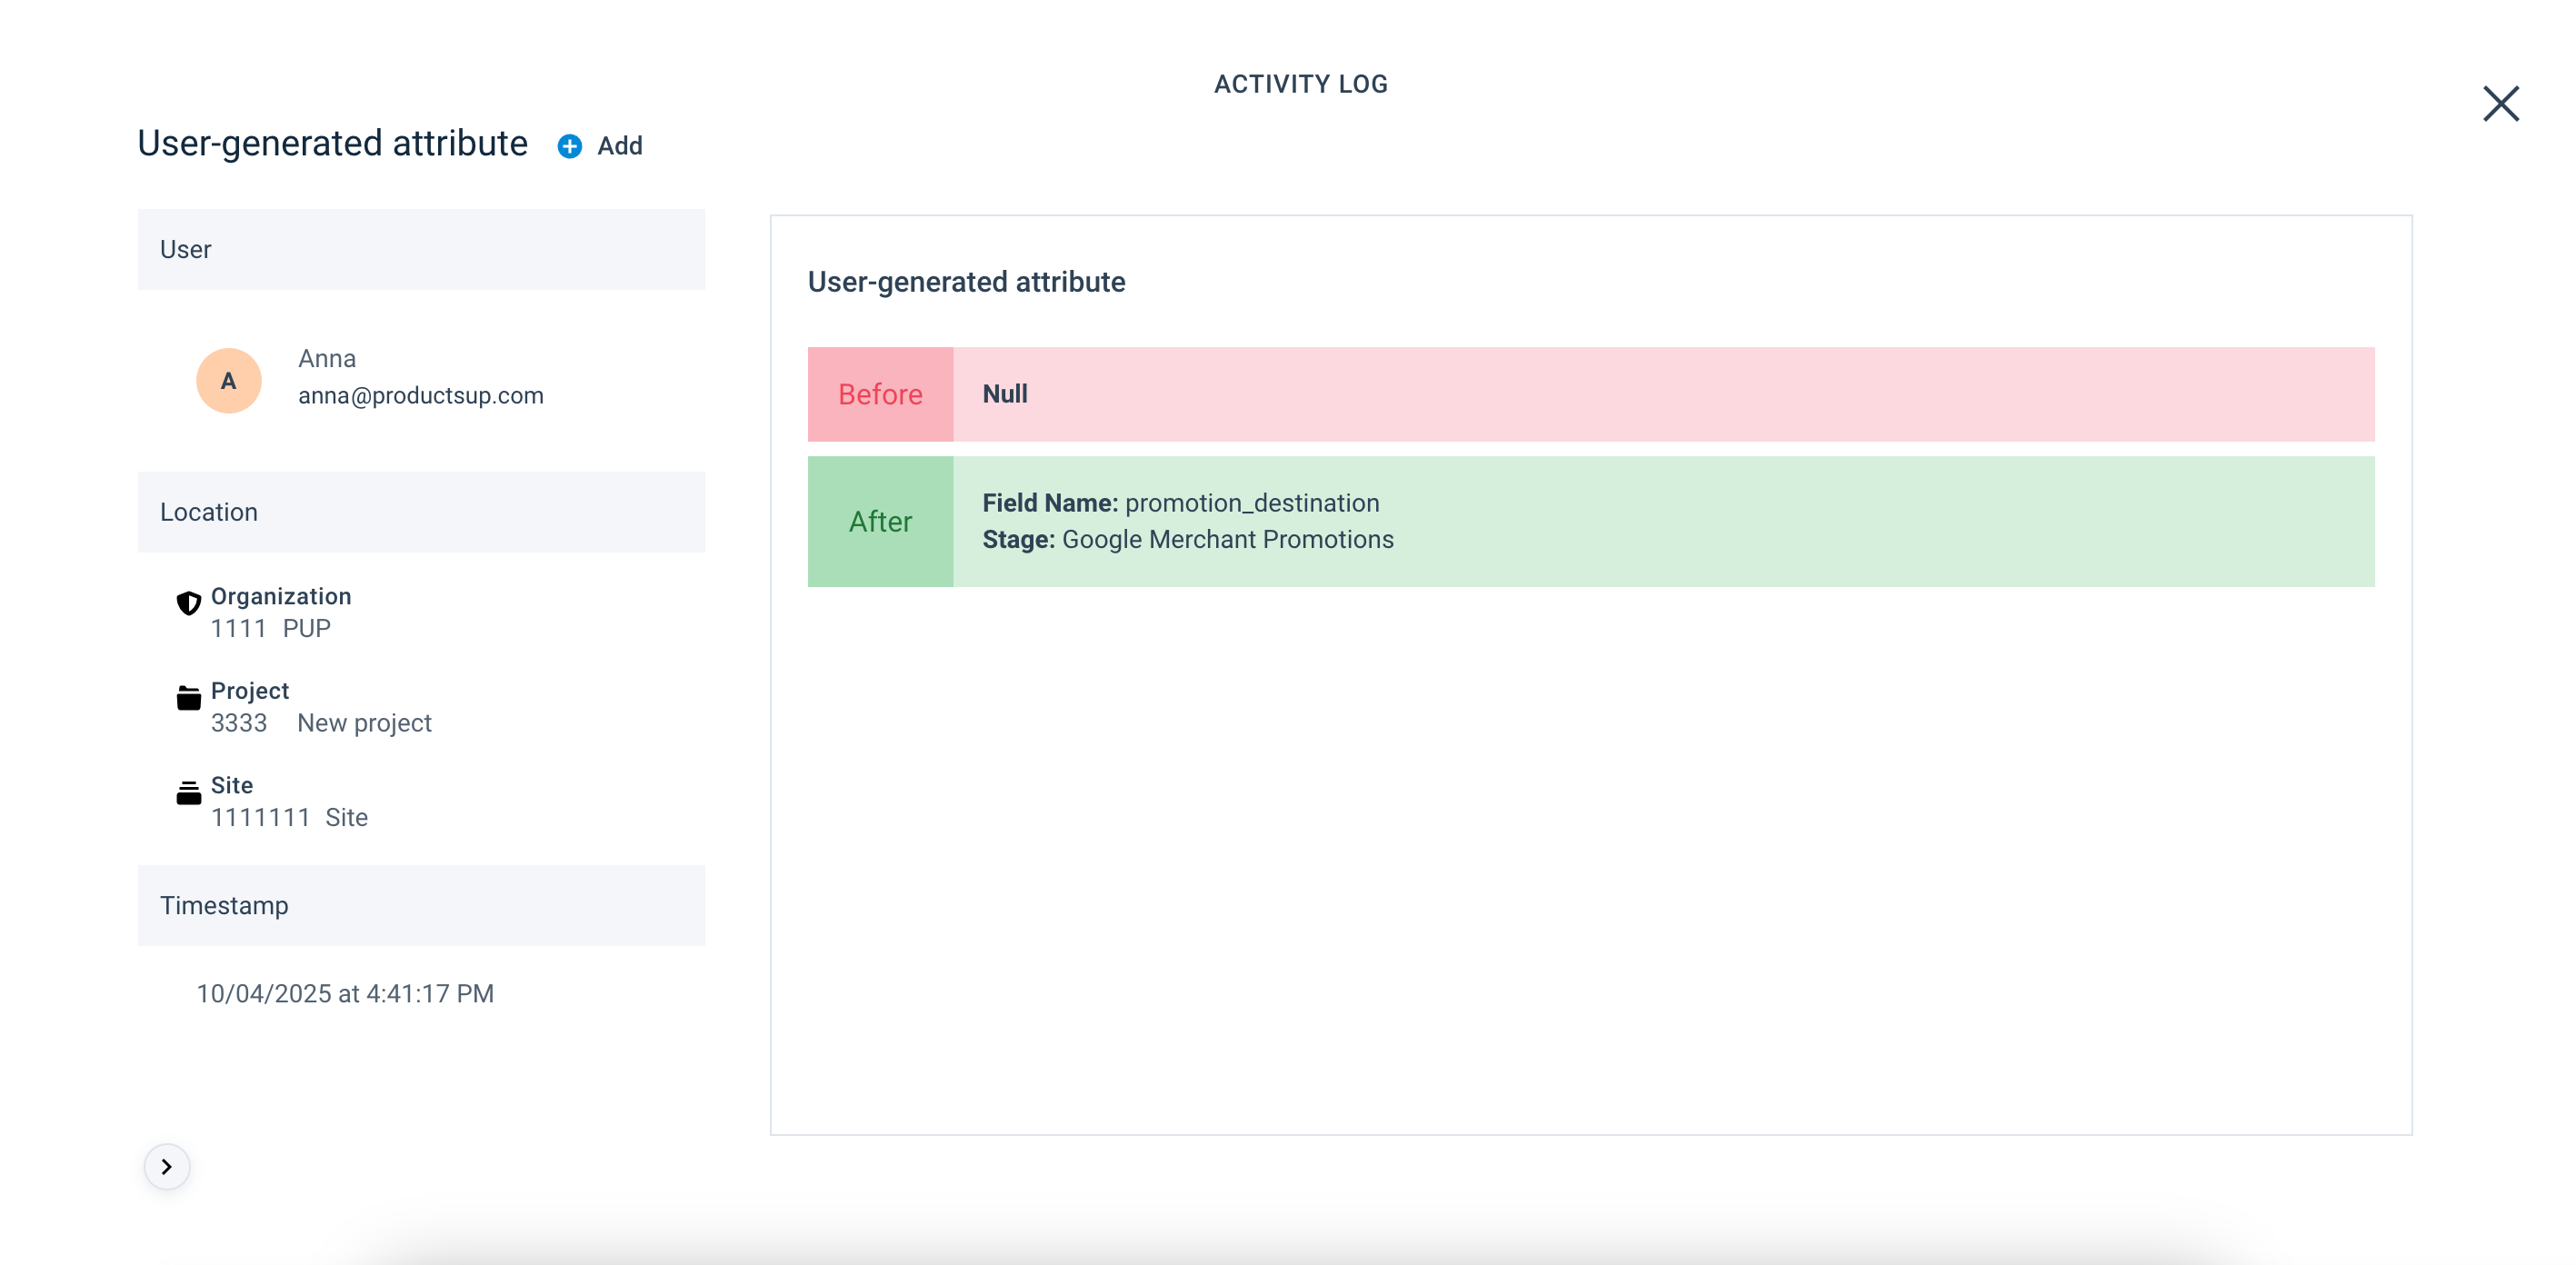
Add, Edit, and Delete identify the type of activity related to the user-generated attribute.
User shows the user who performed the change.
Location displays the organization, project, and site where the change happened.
Timestamp logs the time of the change.
The Before and After panels display:
In Attribute Name, the name of the affected attribute.
In Stage, the stage or export where a user added, edited, or deleted the attribute.
Activity Summary
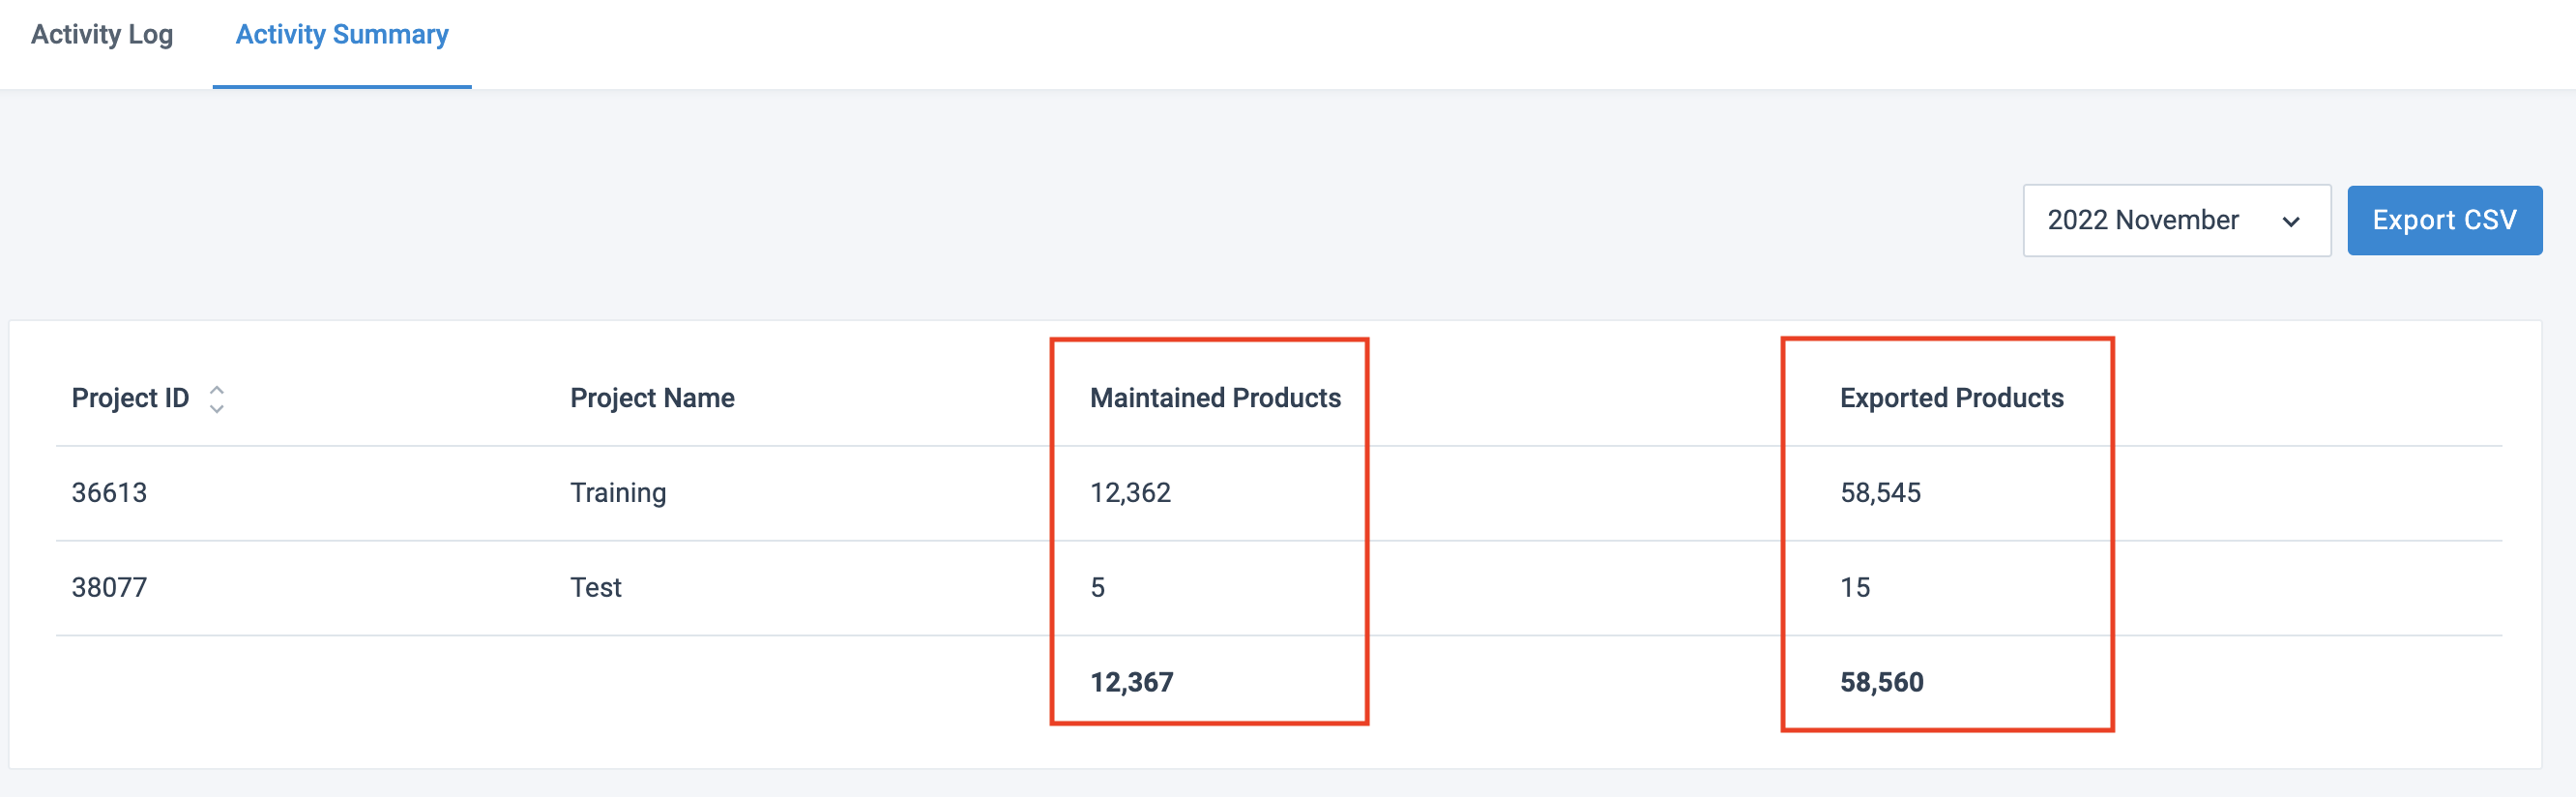
Your Activity Summary displays two KPIs:
Maintained items (previously Maintained Products) show the average monthly number of imported items per site, project, or organization available in Activity. The platform calculates the average number of items in the import and intermediate stages and displays the higher of the two numbers. See a calculation example in the following table.
Exported items (previously Exported Products) show the total monthly number of exported items per site, project, or organization available in Activity.
Note
The platform keeps your data for one (1) year only.
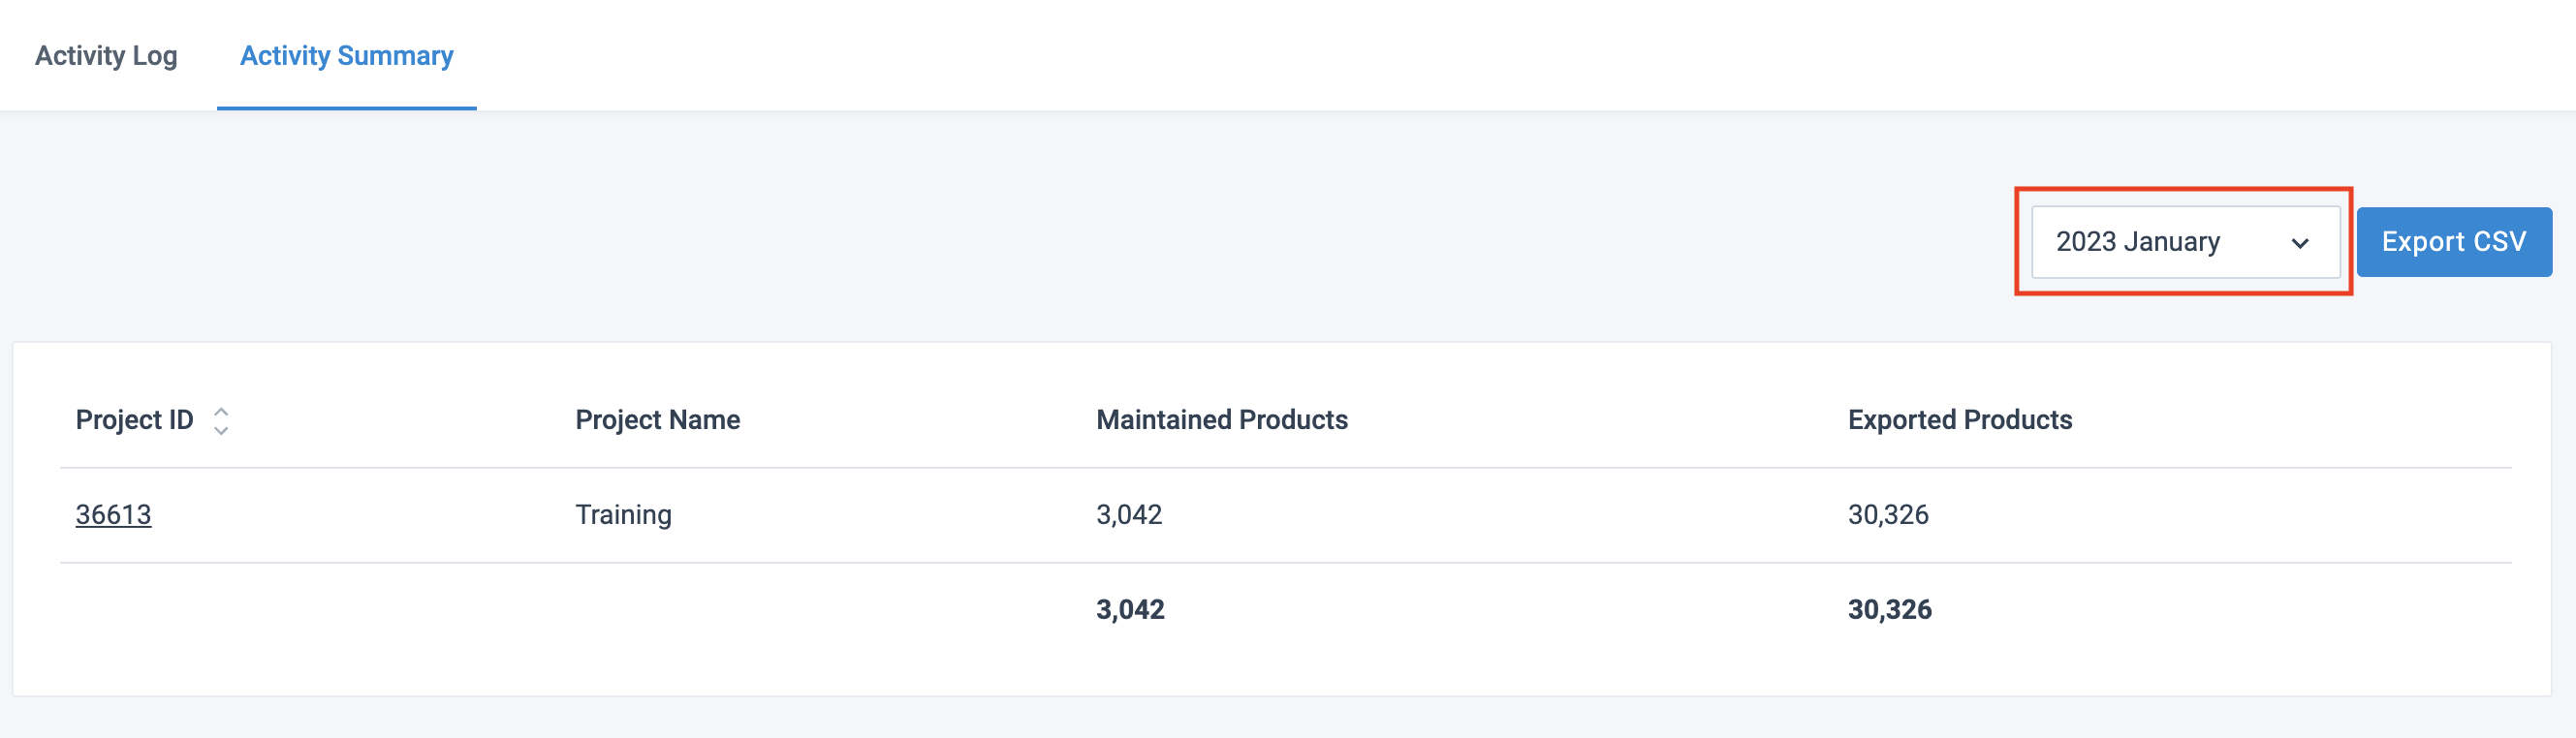
The Activity Summary tab shows you the maintained and exported items for a selected month per project when you are at the organization level. But if you access the Activity Summary tab from the project level, you can see the maintained and exported items per each site within this project. And if you access it from the site level, the Activity Summary tab displays the maintained and exported items only for the current site.
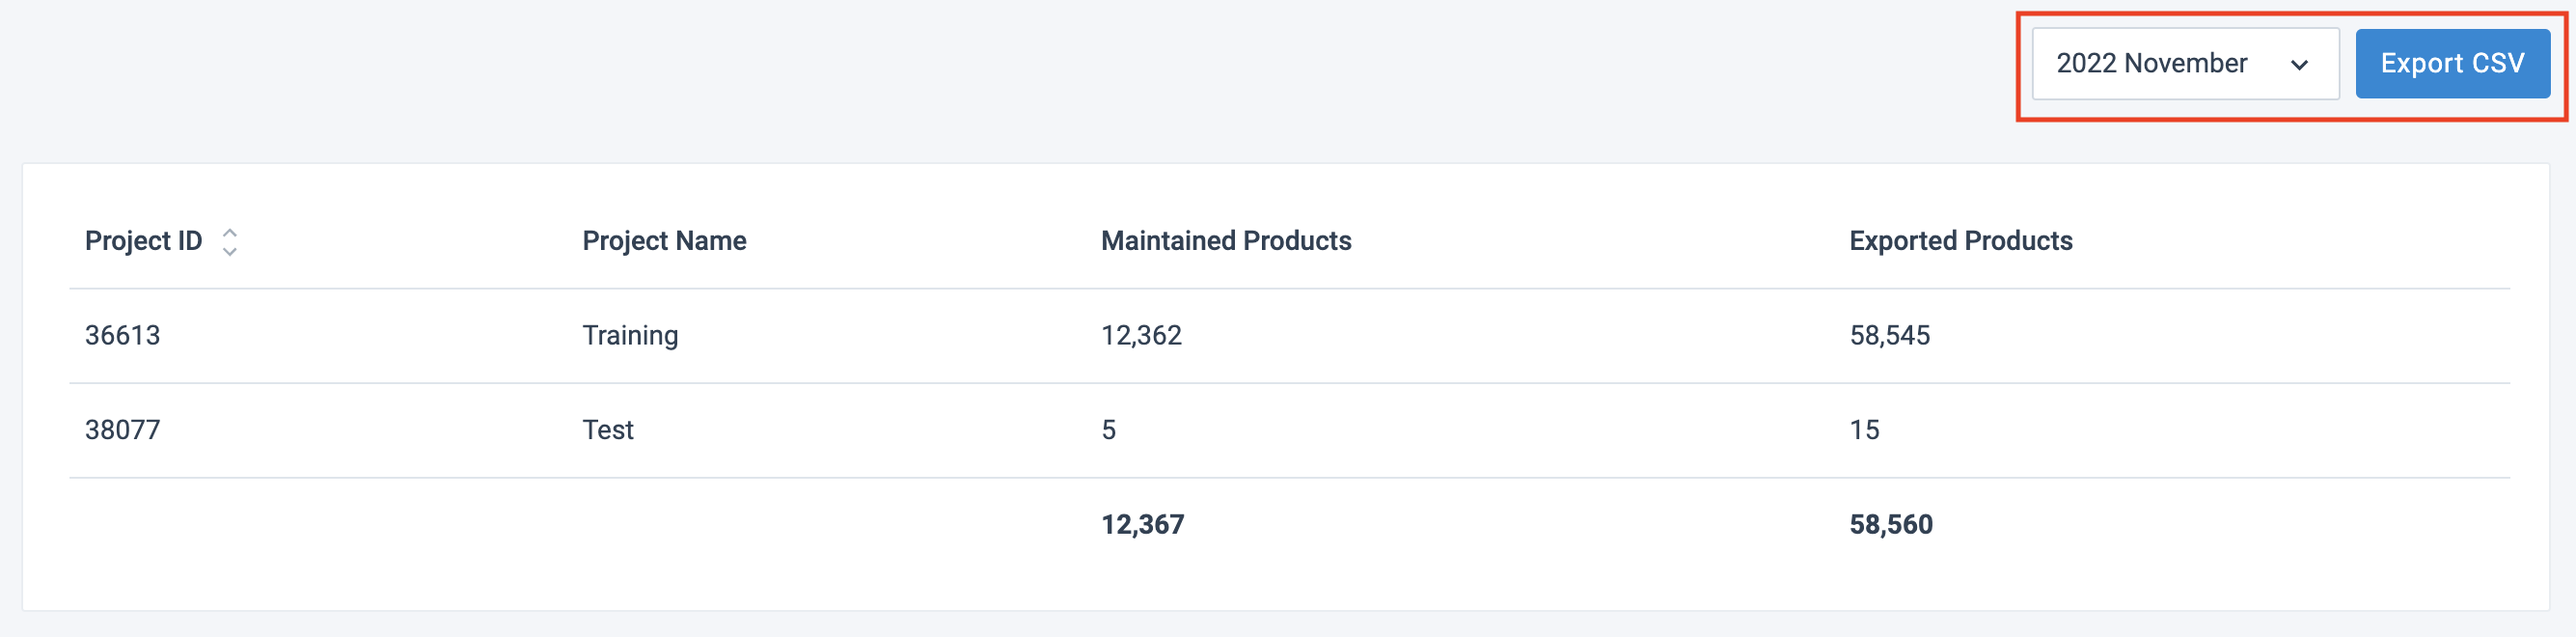
To view your import and export activities for a certain month, choose the month from the dropdown in the top right corner.
Example of maintained items calculation:
In the following table, you can see that the platform triggered a run four times during the month and imported 7,525 items on average (30,100 divided by 4). At the same time, the platform passed 10,000 items on average to the Intermediate stage (20,000 divided by 2). Since the Intermediate average is higher than the Import average, the Activity Summary displays 10,000 as the number of Maintained items for that month.
Event | Item count on Import | Item count on Intermediate | Description |
|---|---|---|---|
Run #1 |
|
| The platform triggered an import, but the file was faulty and only imported 100 out of 10,000 items. The platform passed nothing to the intermediate and export stages. |
Run #2 |
|
| The platform triggered an import again and imported all items successfully. The platform passed nothing to the intermediate and export stages. |
Run #3 |
|
| The platform triggered an import and export for all items and passed them to the intermediate stage and then to the export stage. |
Run #4 |
|
| Scheduling triggered another data import and export, successfully passing all imported items. |
|
| Average maintained items. |
Note
The Activity Summary data might differ from your invoice if you moved a site from your testing or sandbox project to a live project. For example, in January, the sandbox site had 1,000 maintained items. You moved this project to live in February. Now, if you select January to review Activity Summary for January, you see 1,000 maintained items under the live project, even though in that month, they belonged to a sandbox project.
Download Activity Summary
You can download the Activity Summary data as a CSV file for one of the past 12 months as follows:
In the Activity Summary tab, select a month from the dropdown on the right.
Select Export CSV.