Dashboard Charts Graphs
The Dashboard offers a quick overview of all meta data of the current Site.
Products: - Amount of imported products for the last 10 runs - Run ID: ID of the last process - Date: date of the last import
Error Score: - Score: score for the last 10 runs. 0 is the highest/best score and 1000 the lowest/worst. - Run ID: ID of the last process - Date: date of the last import
Status: - Health: The "Health" of the last run. "Failed", "Warning" & "Normal" - State: Live changing state when we process the feed - Last Run: Time of last run
This Month:
Exported: Amount of exported Products for this month
Maintained: Amount of maintained Products this month
Clicks: Overall clicks for the current month
Current Run
Running since: starting time of the last process
Estimated: estimated finish time of the current process
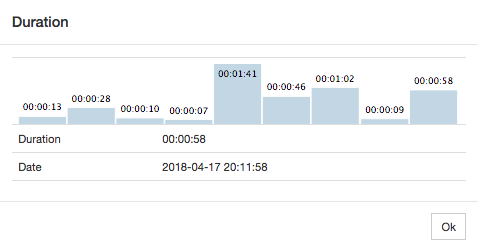
Last Duration: Duration of the last process (see the last nine processes by clicking on the info icon)
Queued Runs
Queued: Amount of process in queue
Since: starting time of the first running process

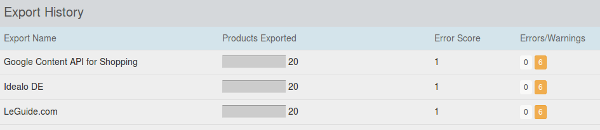
Export History: Provides date, amount of exported products and error score for each export channel.